STEEM Market & Network Pulse — Reading the Chain Behind the Price
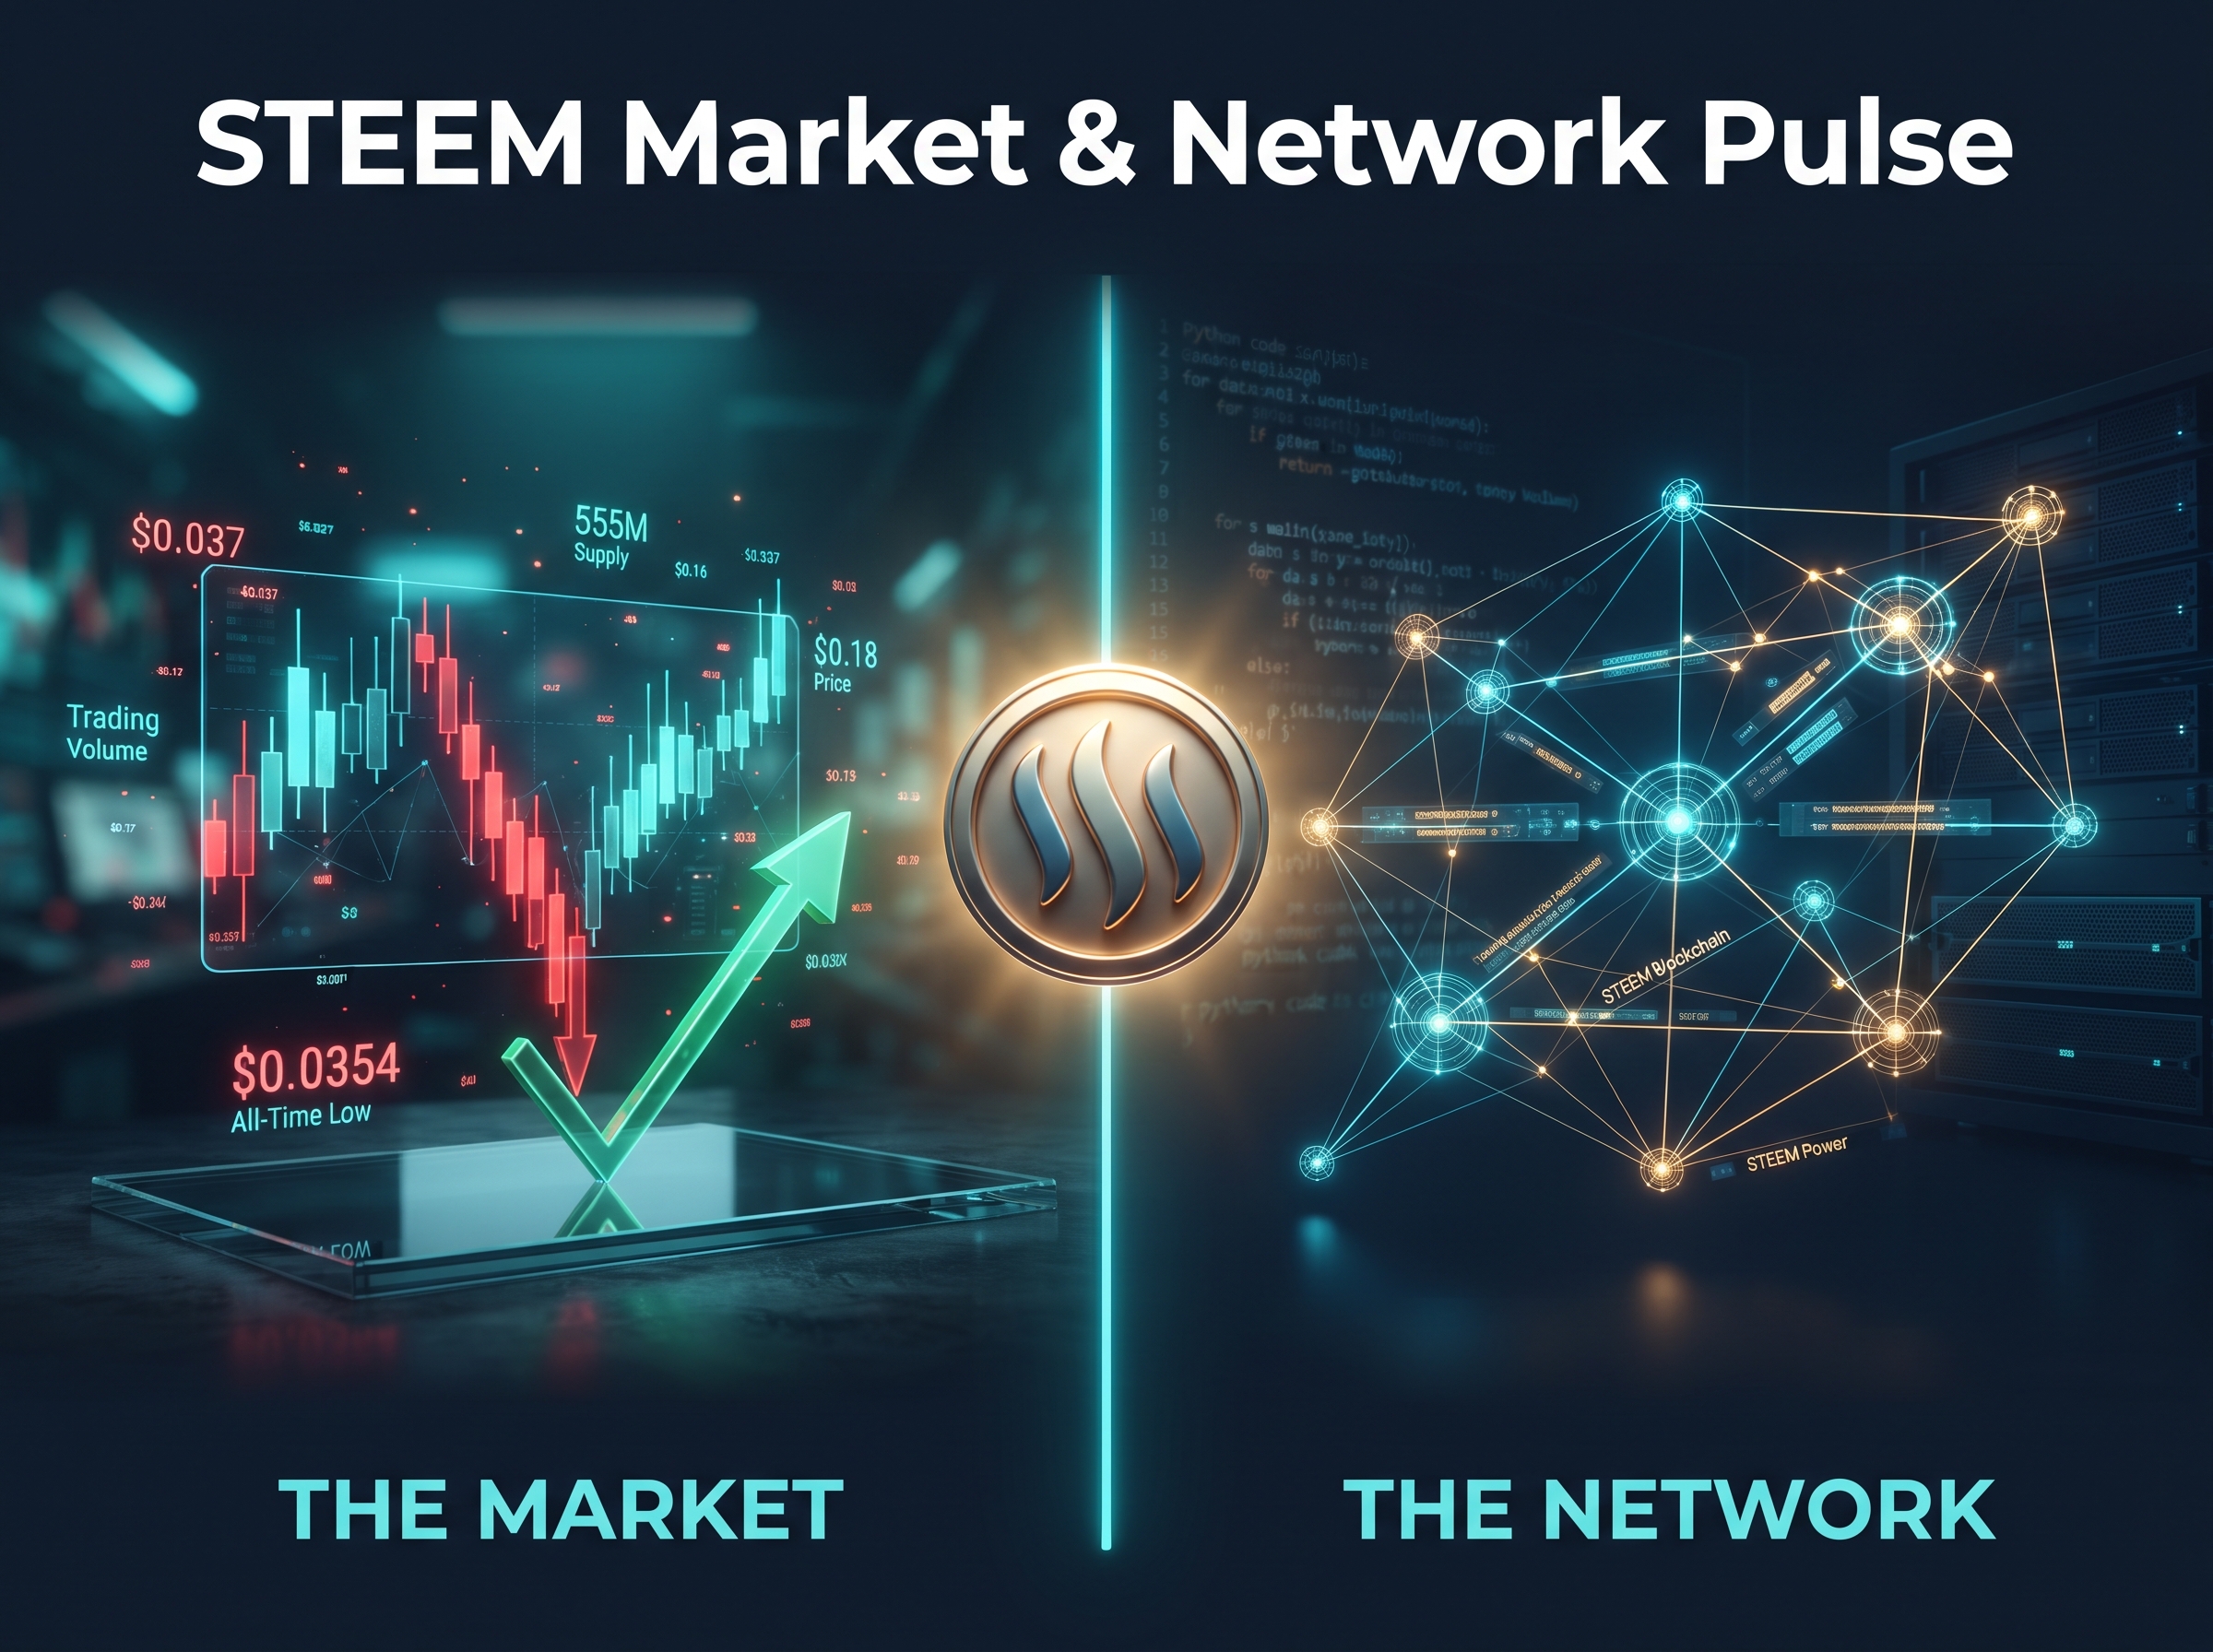
Price charts tell only part of the story of a blockchain network. Behind every candle on a STEEM/USD chart sits a set of on-chain realities — block production, witness participation, staking behavior — that shape whether a token's price action reflects genuine network health or short-term speculation. This post is the first in what I plan to make a recurring series: pulling verifiable market data and Steem on-chain metrics together into one readable snapshot.
For this first edition, I'm laying out the market-side picture in full, backed by verified figures, and outlining the on-chain framework I'll be building out with my own data-pulling scripts in the editions to come.
Part 1: The Market Picture (Verified Data)
As of mid-August 2026, STEEM is trading in a tight, low-volatility range that tells its own story:
- Current price: roughly $0.037, placing STEEM only a few percentage points above its most recent all-time low of $0.0354, which was set on July 29, 2026 — less than three weeks ago.
- All-time high context: STEEM's all-time high was $8.57, reached back in January 2018. The current price represents a decline of more than 99% from that peak, a reminder of how far the token has drifted from its speculative bull-market valuation.
- Market capitalization: approximately $20.4 million, with a circulating supply of roughly 555 million STEEM — effectively uncapped, since STEEM has no hard maximum supply.
- 24-hour trading volume: in the range of $2.3–2.6 million, giving a volume-to-market-cap ratio of roughly 12%. That's a moderately active ratio for a token of this size, suggesting the market isn't dormant even at these price levels.
What this tells us: STEEM is currently trading near a multi-year floor rather than showing renewed strength. For anyone doing technical analysis, the zone between the recent all-time low ($0.0354) and the $0.04 level is worth watching closely — a decisive break in either direction from this range would likely set the tone for STEEM's next multi-week trend.
Part 2: The On-Chain Framework (Coming in Future Editions)
Price alone can't explain why a network is where it is. The more interesting question — and the one I want to answer with my own tooling — is what's happening at the protocol level. Over the next few weeks I'll be building a simple Python-based reporting script (using the beem library against the Steem API) to track:
- Witness block production reliability — missed-block rates across the top 20 active witnesses, since consistent block production is the backbone of network uptime.
- STEEM Power concentration and retention — how much STEEM held by top accounts and witnesses is actively staked (powered up) versus liquid, which is a proxy for long-term confidence in the network.
- Price feed accuracy — how closely witness-reported price feeds track real exchange prices, since this directly affects SBD stability.
- Weekly transaction and active-account counts — a simple but honest measure of whether real usage is growing, flat, or shrinking.
Rather than present borrowed numbers I can't independently verify, I'm holding off on specific witness-level figures until my own script is live. When it is, each future post in this series will pair a market update like the one above with a genuine on-chain reading — not just repackaged price data.
Why This Matters
A lot of crypto content — on Steemit and elsewhere — treats price as the whole conversation. But for a blockchain like Steem, where the entire economy of the platform (rewards, curation, governance) runs through STEEM Power and witness consensus, the on-chain layer is arguably more informative than the price chart alone. My goal with this series is to bring both together, transparently, using data I can actually show my work on.
What's Next
The next edition will include the first live output from my witness-monitoring script, alongside an updated market read. If you're a developer working on similar Steem data tooling, or if you have suggestions for metrics worth tracking, I'd genuinely like to hear them in the comments.
*Data sources: CoinMarketCap and CoinGecko (accessed August 2026) for market figures. On-chain metrics framework based on publicly documented Steem blockchain mechanics (witness block production, STEEM Power staking).