Technical Analysis Update: How Our STEEM/USDT Trade Setup Played Out Perfectly
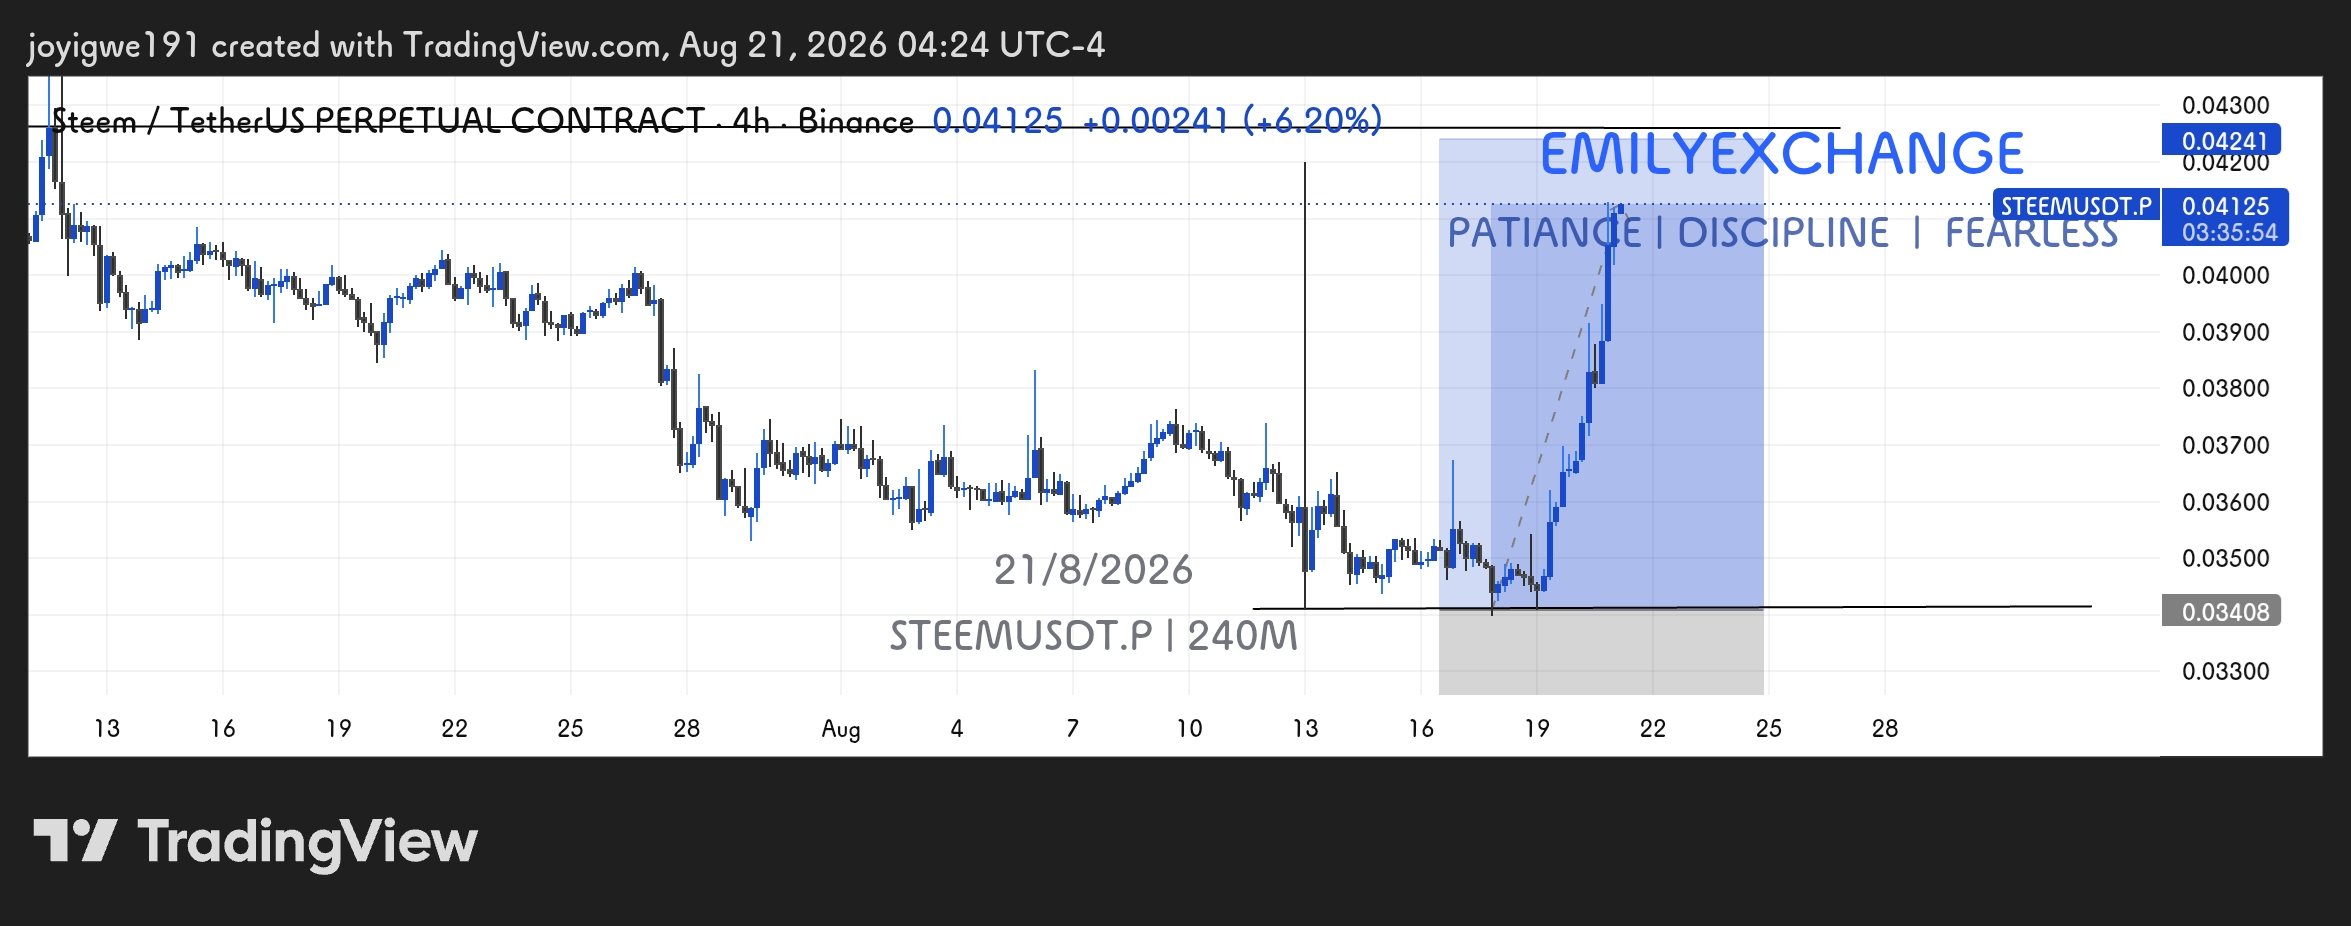
Hello Everyone and community members! In the fast-paced world of cryptocurrency trading, patience, discipline, and a sound strategy are your best assets. A few days ago, I shared a technical setup on the STEEM/USDT perpetual contract (4-hour timeframe). Today, I am excited to do a recap on how the price action unfolded exactly according to the projection.
Let's take a look at how the market progressed step-by-step from our initial analysis to the final breakout.
Phase 1: Identifying the Setup and Accumulation Range
When I first mapped out the chart, STEEM was hovering around a crucial horizontal support zone near the 0.03408 USDT mark. The price had been consolidating downwards for days, but key technical signs pointed toward a potential accumulation floor.
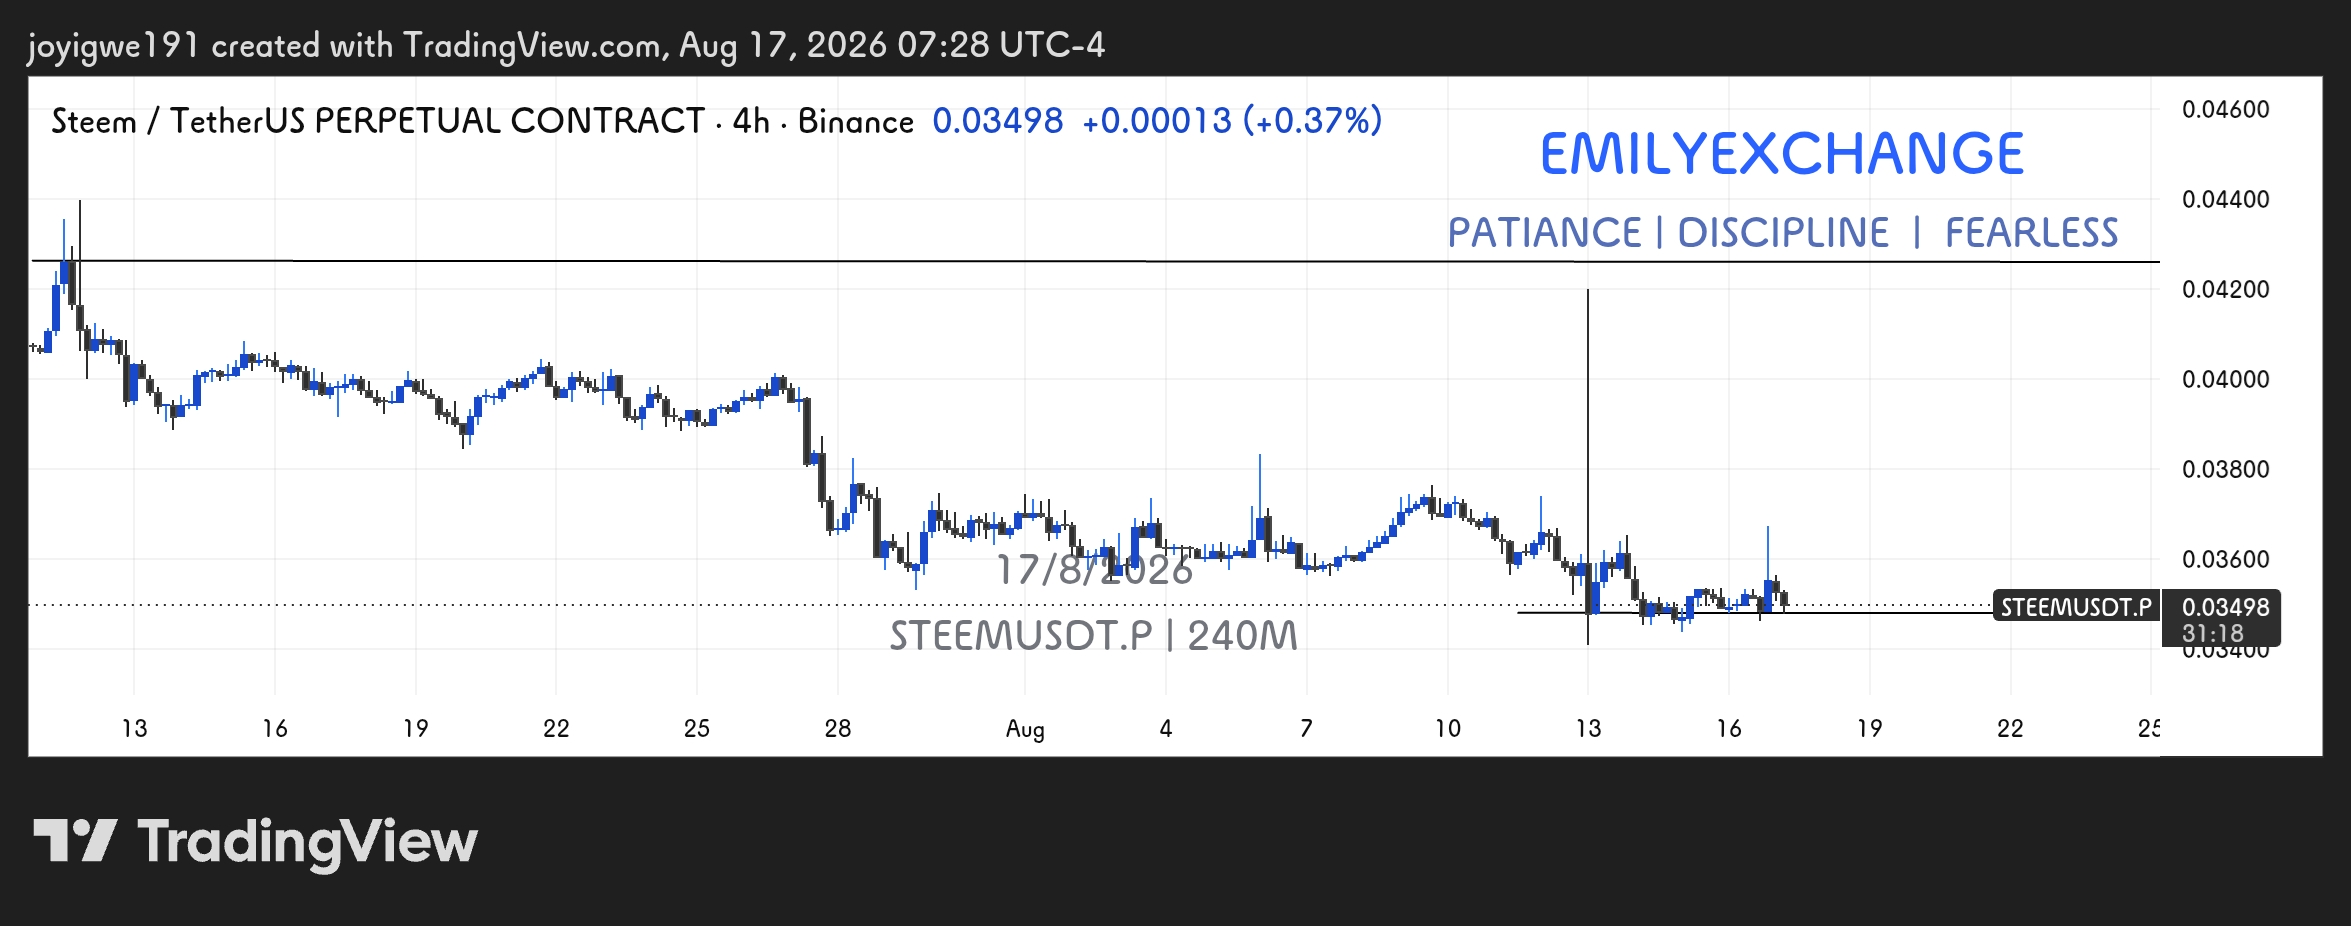
Initial chart layout highlighting the major support floor on STEEM/USDT.
As seen in the chart above, patience was key as the market tested the limits of our psychological boundary. Traders often panic during extended consolidation, but sticking to a disciplined approach allows you to spot where smart money might step in.
Phase 2: Projecting the Move and Setting the Target
Following the initial touch of support, I projected a bullish reversal zone. The expectation was a strong upward bounce once the market cleared out weak hands and found sufficient buying volume near the lows.
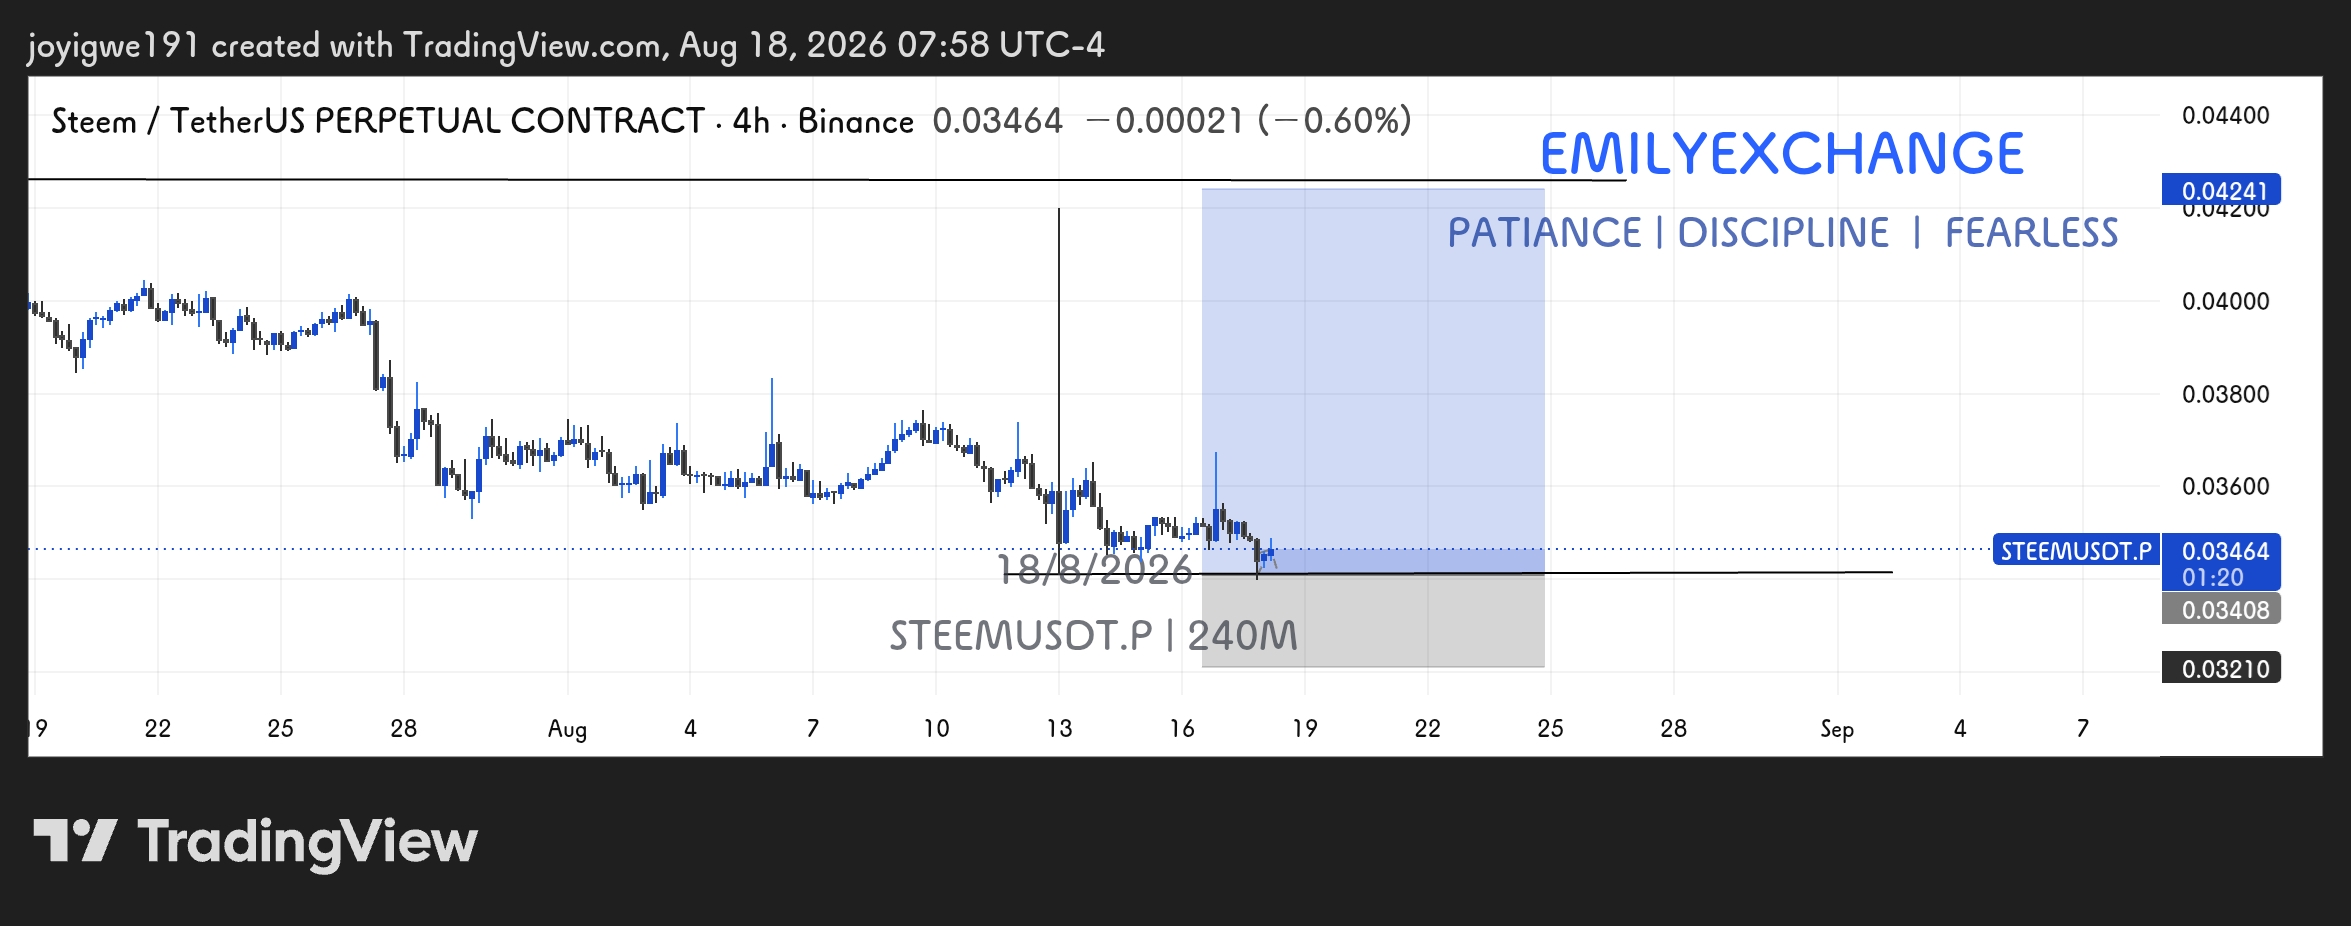
Mapping out the projection box for the anticipated upward momentum.
The blue projection box highlighted a clear path toward the upper resistance zones, targeting a move up to the 0.04241 USDT resistance region.
Phase 3: The Breakdown and Execution
Trading is never about guessing; it is about reacting to confirmation. As the days progressed into August 21, 2026, the market respected our support line down to the decimal. Buyers stepped in aggressively, sparking a sharp and powerful impulse wave upwards.
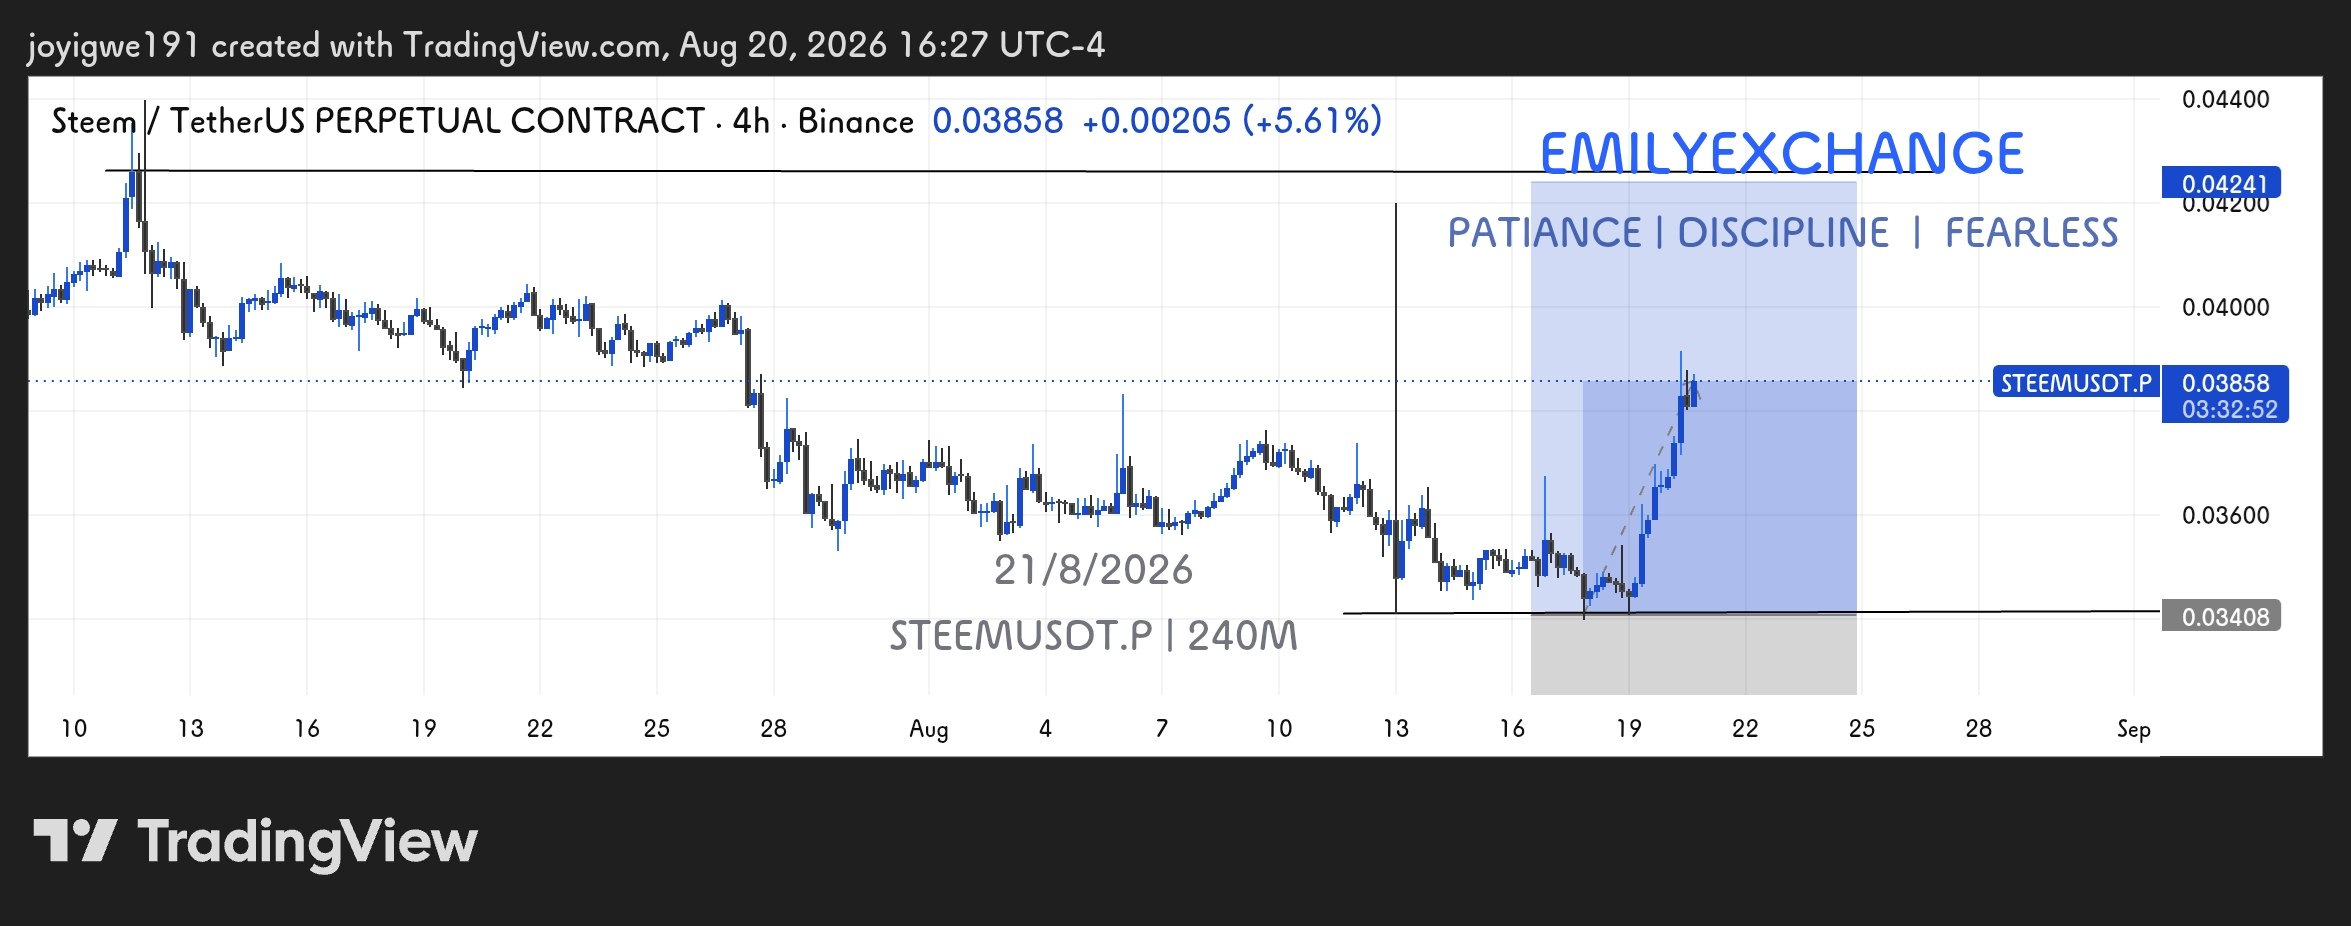
The market breaking out and surging sharply out of the accumulation zone.
The candles exploded to the upside with massive green momentum, breaking through intermediate resistance levels and heading straight toward our projected target zone.
Phase 4: Target Reached and Final Result
Here is how the trade looks as of today. The bullish expansion played out to near perfection, hitting our marked resistance area at 0.04241 USDT with a stellar intraday gain.
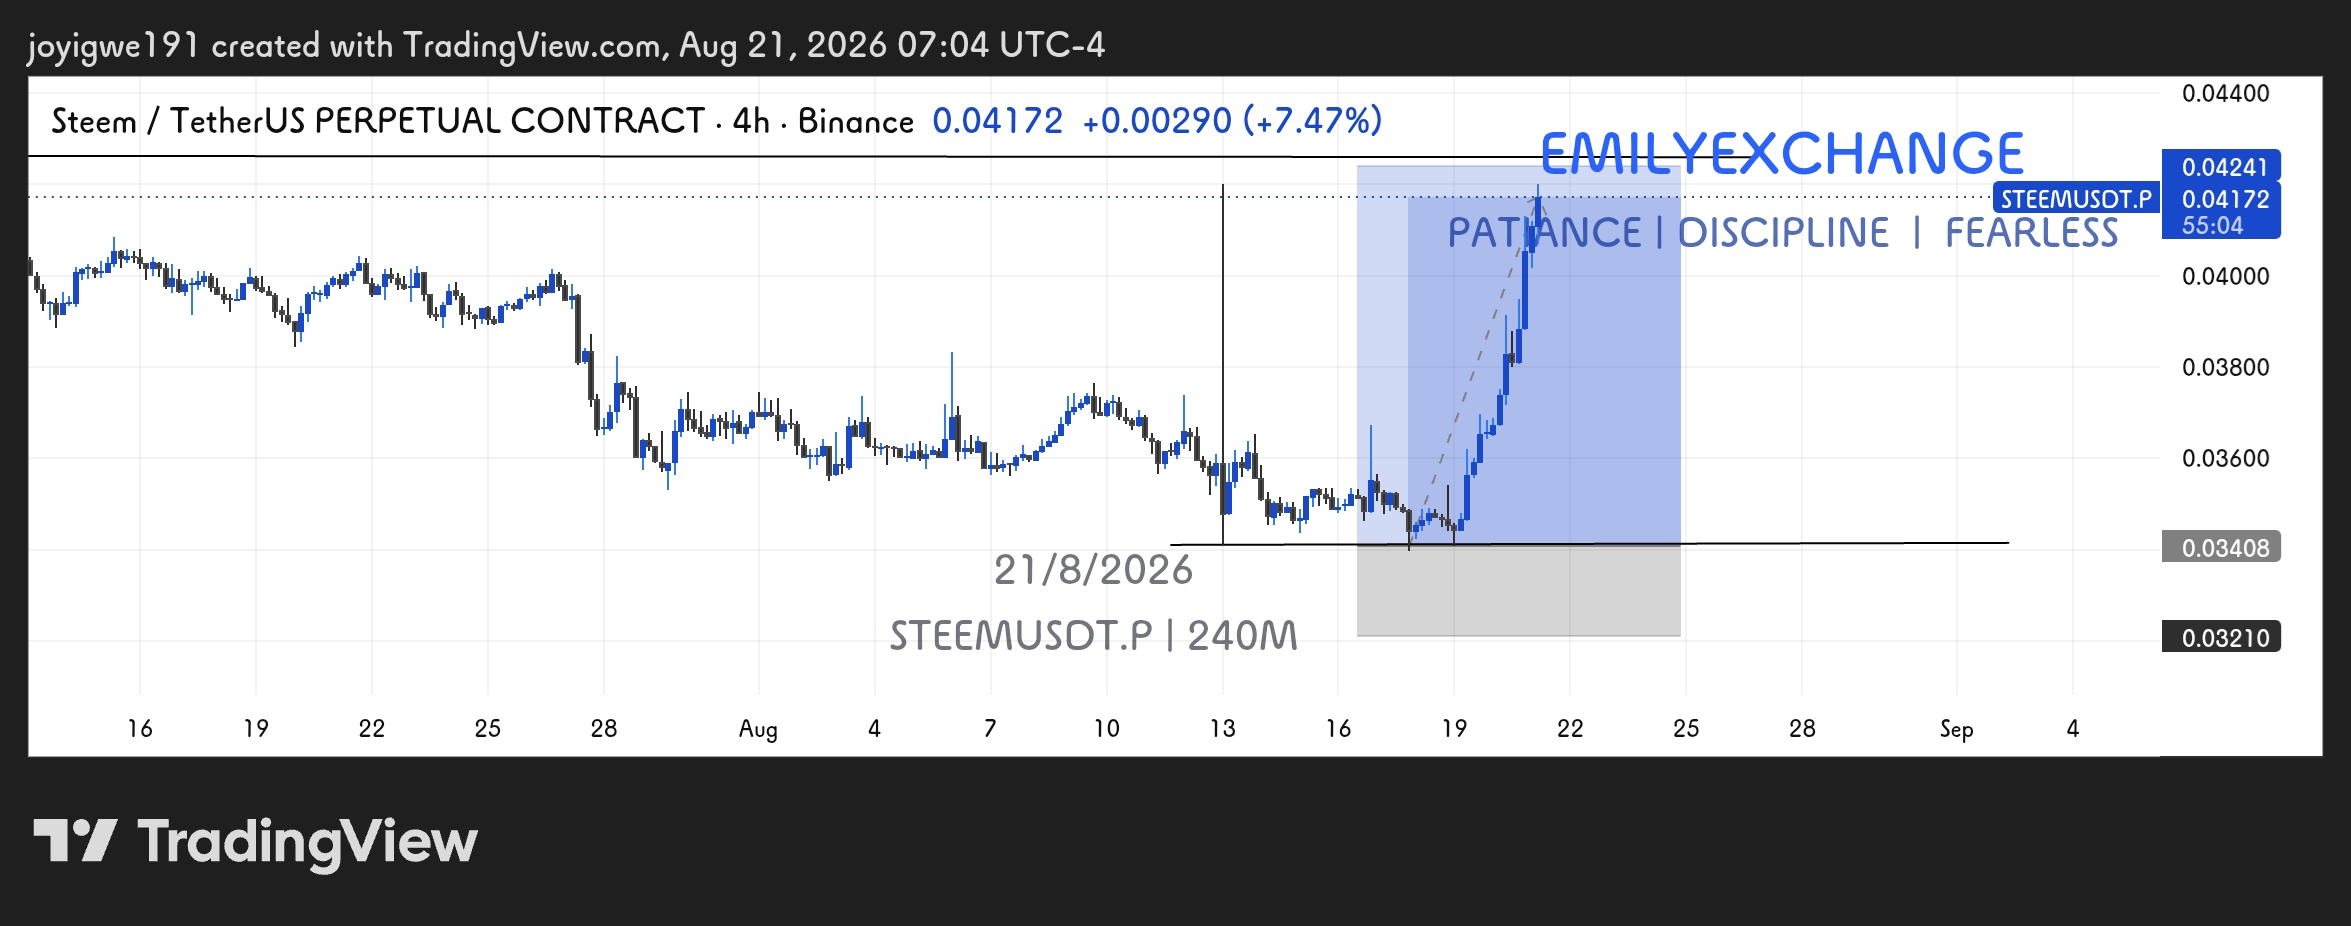
The final outcome showing the clean surge to our target zone.
This trade serves as a reminder that when you combine proper technical analysis with emotional control—remembering our core rules of Patience, Discipline, and Fearlessness the market will often reward your preparation.
I hope you enjoyed this brief technical breakdown. Let me know your thoughts in the comments section below, and happy trading everyone!