Crypto Heatmap
The current crypto market situation looks poor; I can show you the crypto heat map cc you can see how things are going in the market. Obviously, things don't look good. I have shared the heat map chart below, where you can clearly see that the green colour is rarely visible with some coins, and that too with a very low percentage. Red is the colour that you can see across the page, and even the USDC coin is showing in grey, which means there is no plus or minus movement. This is fine because it is a stablecoin, and it is not expected to move like normal crypto coins in the market.
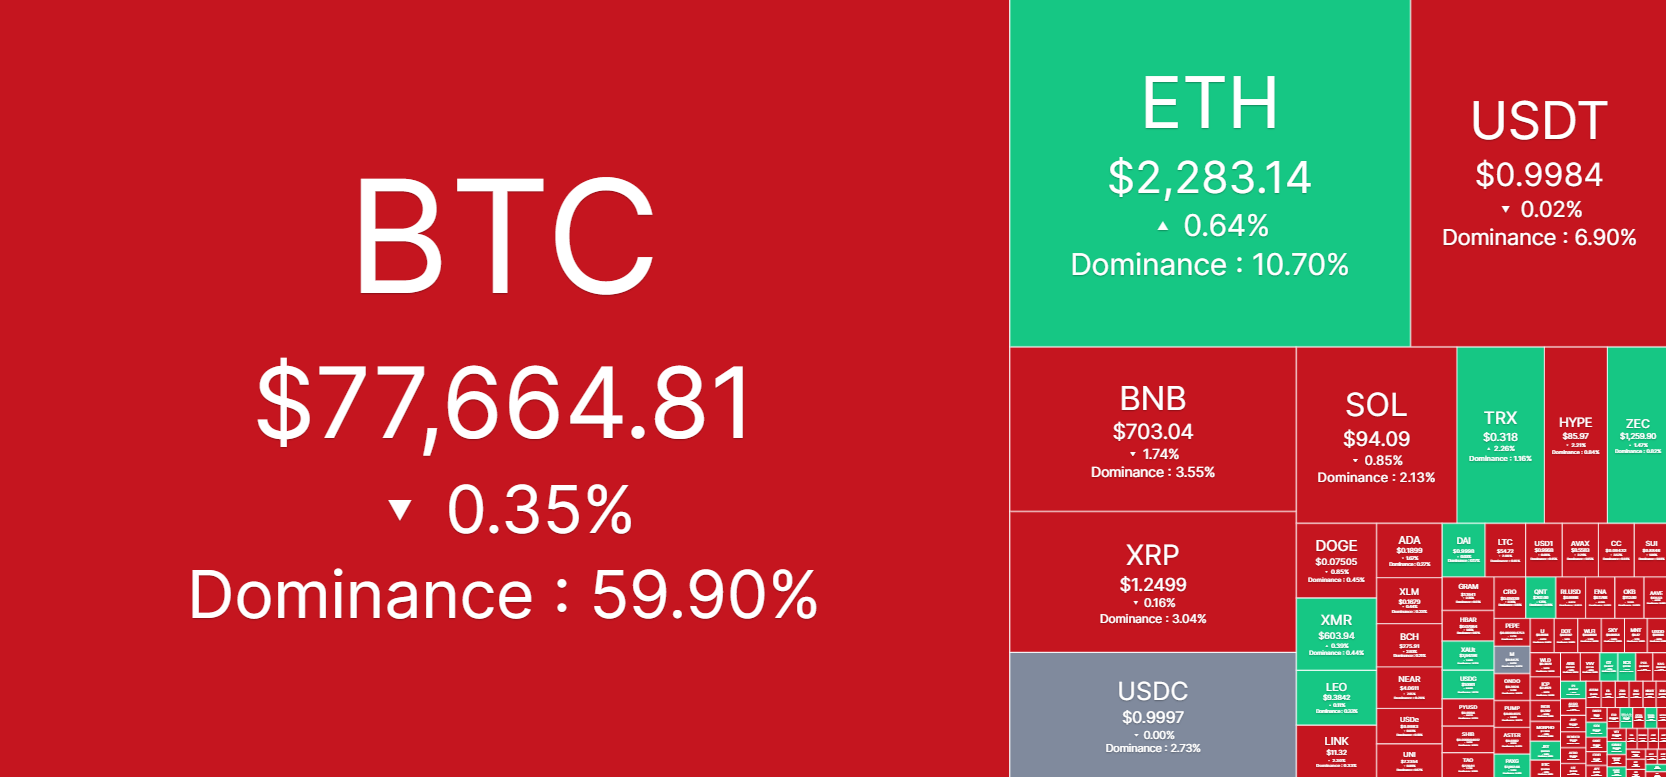
This situation is surely not good for the market, but I think this is temporary. It is obvious that when one of the biggest hikes has happened in the market, you can expect this type of momentum. The current price for Bitcoin is less than 78,000, whereas its dominance is slightly less than 60%. I think this is good because 60% dominance in the market is such a big percentage, which still shows that a lot of people still believe in Bitcoin.
I hope this situation improves and people get more positivity in the market, but obviously, we know that it is not in our hands and we cannot control anything. It depends on the entire market segment and how it is going to perform. Let's wait and see how things are going to take shape in the market.
Thank you for stopping by. If you like my content, please vote and share your thoughts in the comments section.
10% beneficiary to Tron-fan-club