Asia Pacific Silica Sand Market to Reach USD 11,522.5 Million by 2034 at 5.57% CAGR: IMARC Group
Asia Pacific Silica Sand Market Outlook
This IMARC Group study provides a forecast of market size, share, and emerging trends for the Asia Pacific Silica Sand Market for 2026–2034. The report covers segmentation by end use and country, with coverage across China, India, Malaysia, South Korea, Japan, Australia, and Others.
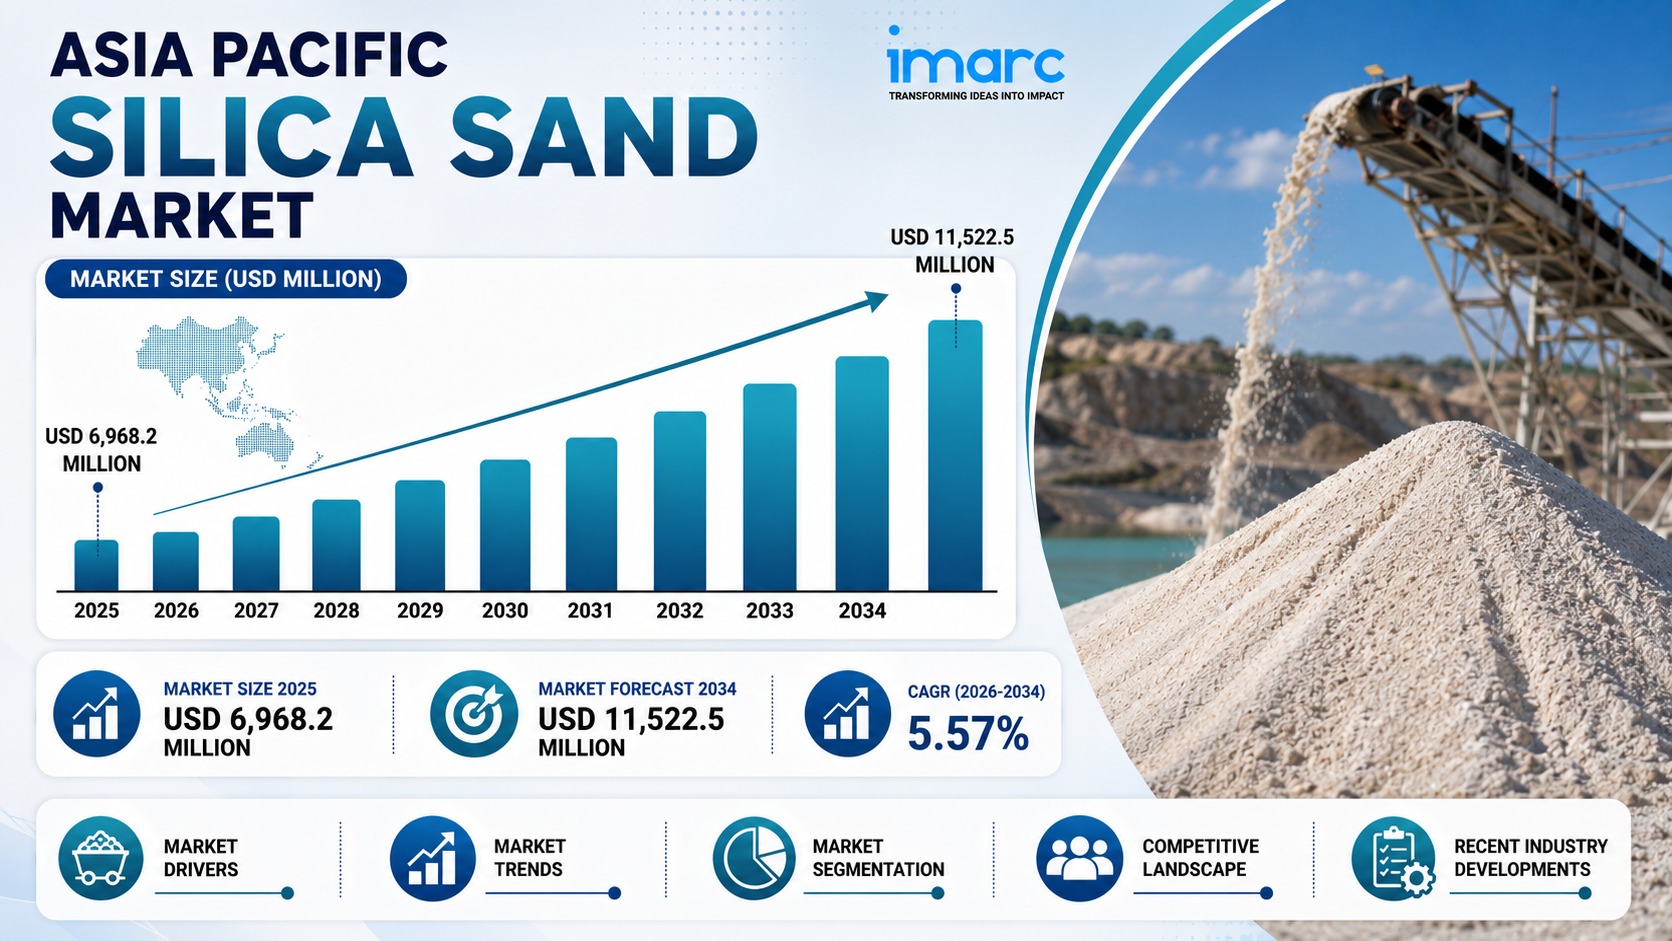
Market Snapshot
- Base Year Market Size (2025): USD 6,968.2 Million
- Forecast Market Size (2034): USD 11,522.5 Million
- CAGR (2026–2034): 5.57%
- Base Year: 2025
- Forecast Period: 2026–2034
- Leading End Use: Glass Industry (34.2%, 2025)
- Leading Country: China (38.6%, 2025)
What Is the Current Size of the Asia Pacific Silica Sand Market?
The Asia Pacific Silica Sand Market reached USD 6,968.2 Million in 2025 and is projected to reach USD 11,522.5 Million by 2034, growing at a CAGR of 5.57% during 2026–2034. Asia Pacific Silica Sand Market growth rests on construction-led flat and container glass demand, foundry revival for EV and wind-power castings, hydraulic fracturing expansion in China, and tightening regulation of illegal sand mining that formalises supply toward compliant operators.
What Are the Emerging Trends in the Asia Pacific Silica Sand Market?
Construction-Led Glass Demand Anchors Volume Growth
Glass grade sand remains the workhorse of the market, with flat and container glass output tracking rapid urbanisation and vehicle production across the region. India alone expects flat-glass consumption to top 800 million square meters by 2027 under its Housing for All and Smart Cities programmes, and within ASEAN more than a dozen metro systems and 18 airport expansions are scheduled before 2030 . This matters because glass manufacturing consumes 60–70% of a float-glass batch as silica sand, so furnace siting increasingly depends on proximity to clean feedstock rather than on legacy industrial locations . The demand pull is structural and tied to infrastructure pipelines that are already funded and scheduled.
Hyper-Purity Quartz Moves from Niche to Strategic
Hyper HPQ expanded at an 11.32% CAGR through 2031 and commands a 300–500% price premium over standard grades, reshaping exploration budgets and capital deployment . Semiconductor manufacturers pushing below the 3-nanometer design rule are driving demand for ultra-high-purity quartz crucibles, and suppliers including VRX Silica are targeting 99.99% SiO₂ output for semiconductor applications . This matters because the value of the market is shifting toward purity rather than volume. A tonne of semiconductor-grade quartz is worth several times a tonne of glass-grade sand, and the suppliers who can document and certify that purity capture margins that commodity miners cannot.
Illegal Mining Crackdowns Formalise Supply
India’s Supreme Court imposed a nationwide ban on unauthorised river-sand extraction in 2024, redirecting demand toward licensed quarries and boosting landed costs for contractors. Indonesia intensified patrols in the Riau Archipelago, Vietnam cancelled 47 licences, and the Philippines suspended extraction across 12 provinces . This matters because enforcement removes low-cost informal supply from the market, which raises prices in the short term but strengthens the position of compliant, higher-cost operators. Buyers that previously sourced from unlicensed miners now pay for certified material, and the price gap between informal spot cargoes and contract-grade supplies has widened .
Foundry Demand Specialises Around EV and Wind Castings
Electric-vehicle casting technology increasingly specifies narrow thermal-expansion bands, pushing foundries toward calibrated silica sand blends with tighter grain-size distributions. China’s clean-energy manufacturing leadership created a lift in aluminium and ductile-iron casting that consumed roughly 9.1 million tons of foundry sand region-wide in 2024 . This matters because the foundry segment is not growing uniformly; it is shifting toward higher-specification sand that meets the thermal and dimensional requirements of EV components and wind-turbine housings. Producers that certify thermal-shock performance and dimensional accuracy are capturing multi-year supply contracts from battery and turbine OEMs.
Request Sample Report with Datasheet: https://www.imarcgroup.com/asia-pacific-silica-sand-market/requestsample
What Factors Are Driving the Growth of the Asia Pacific Silica Sand Market?
Glass Manufacturing Expansion Across the Region
The glass industry holds 34.2% share in 2025, driven by rising demand for construction glass, automotive glass, packaging containers, and specialty glass for electronics. Silica sand enhances transparency, strength, and thermal resistance in glass, and its use in fiberglass supports insulation, roofing, and composite materials . This matters because glass demand tracks construction and automotive cycles, both of which are expanding in India, Indonesia, Vietnam, and the Philippines as urban infrastructure programmes advance. Every new float-glass furnace requires a dedicated silica sand supply contract, often secured before construction begins.
Infrastructure Spending Embeds Sand Demand
ASEAN governments allocated USD 13.2 billion to transport corridors, grid upgrades, and municipal water treatment in the first half of 2024, all of which embed silica sand as fine aggregate in concrete and asphalt. Indonesia’s Nusantara capital-city build alone is forecast to consume 50 million cubic meters of sand this decade . This matters because infrastructure demand is less cyclical than private construction. A government-funded road or airport project proceeds on a schedule that is set by budget allocation rather than market sentiment, which provides a stable demand floor for sand producers serving those projects.
Hydraulic Fracturing Growth in China
Hydraulic fracturing holds 16.8% share in 2025 and is the fastest-growing end-use segment, supported by expanding unconventional oil and gas extraction, particularly in China. China’s shale gas development is supported by policy targets that treat unconventional gas as a strategic substitute for coal, and silica sand remains the preferred proppant due to its low cost and stable physical properties . This matters because fracking demand is concentrated and contract-driven. A single procurement from a major oil company can absorb hundreds of thousands of tonnes, and suppliers with qualified proppant grades can secure multi-year offtake agreements.
Water Treatment Requirements Expand Filtration Demand
Filtration holds 12.4% share in 2025, supported by growing municipal and industrial water treatment requirements. This matters because water treatment infrastructure is expanding across the region as urban populations grow and industrial discharge regulations tighten. Silica sand serves as a filtration medium in both municipal water plants and industrial wastewater systems, and the demand scales with the volume of water treated rather than with construction activity alone.
What Are the Opportunities in the Asia Pacific Silica Sand Market?
High-Purity Quartz for Semiconductor Applications
The 300–500% price premium for hyper HPQ creates an opportunity for producers that can certify 99.99% SiO₂ output and document impurity levels at the parts-per-billion scale . Semiconductor manufacturers in South Korea, Japan, and Taiwan require crucibles and quartzware that meet stringent specifications, and the supply of qualified producers is limited. The opportunity lies in beneficiation investment—acid leaching, flotation, and magnetic separation—that moves a producer from glass-grade into the semiconductor supply chain.
Solar Glass and Low-Iron Sand
Solar glass production requires low-iron silica sand to maximise light transmission, and the region’s rapid solar infrastructure expansion is creating demand for this specific grade . The opportunity lies in serving solar glass manufacturers that are adding capacity to meet renewable energy targets. Solar glass furnaces require consistent low-iron feedstock, and producers that can guarantee iron content below the threshold for high-transmission glass can secure premium contracts.
Australia as a Supply Base for High-Purity Exports
Australia’s high-purity output is largely exported, with 60–70% of production going to buyers in China, Japan, and South Korea, and producers including VRX Silica are positioning to supply the Asian market via seaborne trade . The opportunity lies in filling the supply gap left by tightening environmental enforcement in Asian source countries. Australian deposits can supply high-purity grades that meet Japanese and Korean specifications, and the trade corridor is already established.
What Are the Challenges in the Asia Pacific Silica Sand Market?
Regulatory Compliance Adds Operating Costs
New exposure limits for respirable crystalline silica—50 µg/m³ in India—mandate capital upgrades like wet-scrubbing and enclosed conveyors, adding 4–6% to mining operating expenses for compliant operators . This matters because the compliance cost falls unevenly. Large integrated miners can absorb the investment and pass it through to contract prices, while smaller operators may be forced out of the market. The consolidation that results is healthy for supply discipline but painful for the operators who cannot fund the upgrades.
Logistical Constraints and Freight Costs
Inadequate transportation infrastructure and logistical inefficiencies hinder the timely and cost-effective movement of silica sand from mines to processing units and end-users, and remote locations with poor road connectivity increase transportation costs . This matters because silica sand is a bulky, low-value-per-tonne material, and freight can represent a significant share of delivered cost. A mine that is 200 kilometres from a port may be uneconomic to develop even if the deposit quality is high, which limits the number of viable supply sources.
Substitution Pressure in Construction Applications
Engineered, sand-free building materials are emerging as a substitute in some construction applications, and the substitution risk is highest in applications where sand serves as a bulk filler rather than a functional component . This matters because construction is a large-volume outlet for lower-grade sand. If alternative materials gain share in concrete and asphalt, the demand impact would be concentrated in the commodity end of the market, while high-purity segments for glass and electronics would remain insulated.
What Are the Key Market Segments in the Asia Pacific Silica Sand Market?
The Asia Pacific Silica Sand Market is segmented by end use and country.
Which End Uses Lead the Asia Pacific Silica Sand Market?
- Glass Industry
- Foundry
- Hydraulic Fracturing
- Filtration
- Abrasives
The glass industry leads with 34.2% share in 2025 due to rising demand for construction glass, automotive glass, packaging containers, and specialty glass for electronics. Foundry follows at 21.6%, driven by metal casting demand across automotive, machinery, steel, and construction equipment manufacturing. Hydraulic fracturing at 16.8% is the fastest-growing segment, supported by expanding unconventional oil and gas extraction in China.
Which Countries Lead the Asia Pacific Silica Sand Market?
- China
- India
- Malaysia
- South Korea
- Japan
- Australia
- Others
China leads with 38.6% share in 2025 due to abundant silica sand reserves, large-scale industrial consumption, construction activity, glass manufacturing, electronics production, and hydraulic fracturing. India is the significant secondary market at 22.4%, supported by infrastructure investment, rapid urbanisation, and growing construction, glass manufacturing, and foundry industries.
Who Are the Key Players in the Asia Pacific Silica Sand Market?
Diatreme Resources Limited, JFE Mineral & Alloy Company, Ltd., Mangal Minerals, Mitsubishi Chemical Group Corporation, TOCHU Corporation, VRX Silica Ltd, and Xinyi Golden Ruite Quartz Materials Co., Ltd. compete in this market. Competition centres on purity certification and beneficiation capability, long-term offtake contracts with glass manufacturers and semiconductor suppliers, export logistics from Australia and China, and compliance with tightening environmental and safety regulations.
What Are the Latest Recent Developments in the Asia Pacific Silica Sand Market?
In 2026, environmental enforcement across the region reshaped supply dynamics, with India’s Supreme Court ban on unauthorised river-sand extraction redirecting demand toward licensed quarries, Indonesia intensifying patrols in the Riau Archipelago, Vietnam cancelling 47 licences, and the Philippines suspending extraction across 12 provinces . The crackdowns eliminated low-cost informal supply and accelerated formalisation toward compliant, higher-cost operators, with the price gap between informal spot cargoes and contract-grade supplies widening as a result.
Customization Note: If you require any specific information not covered within this report's scope, we will provide it as part of the customization.
Request Report Customization: https://www.imarcgroup.com/request?type=report&id=2310&flag=E
Media Contact:
Company Name: IMARC Group
Email: sales@imarcgroup.com
Contact: +1-201971-6302
Address: 134 N 4th St., Brooklyn, NY 11249, USA