Bybet Casino PH Basketball Usage Guide: Why More Offensive Responsibility Can Change Efficiency
Bybet Casino PH Basketball Usage Guide: Why More Offensive Responsibility Can Change Efficiency
A basketball analytics guide explaining usage percentage, true shooting percentage, turnovers, role difficulty, lineup context and why volume and efficiency must be read together.
A player can become more important to an offense and less efficient at the same time. That sounds contradictory only if offensive volume and scoring efficiency are treated as the same statistic. For Filipino readers usingBybet Casino PH
as a sports-information reference, usage percentage and true shooting percentage are useful precisely because they separate those questions.
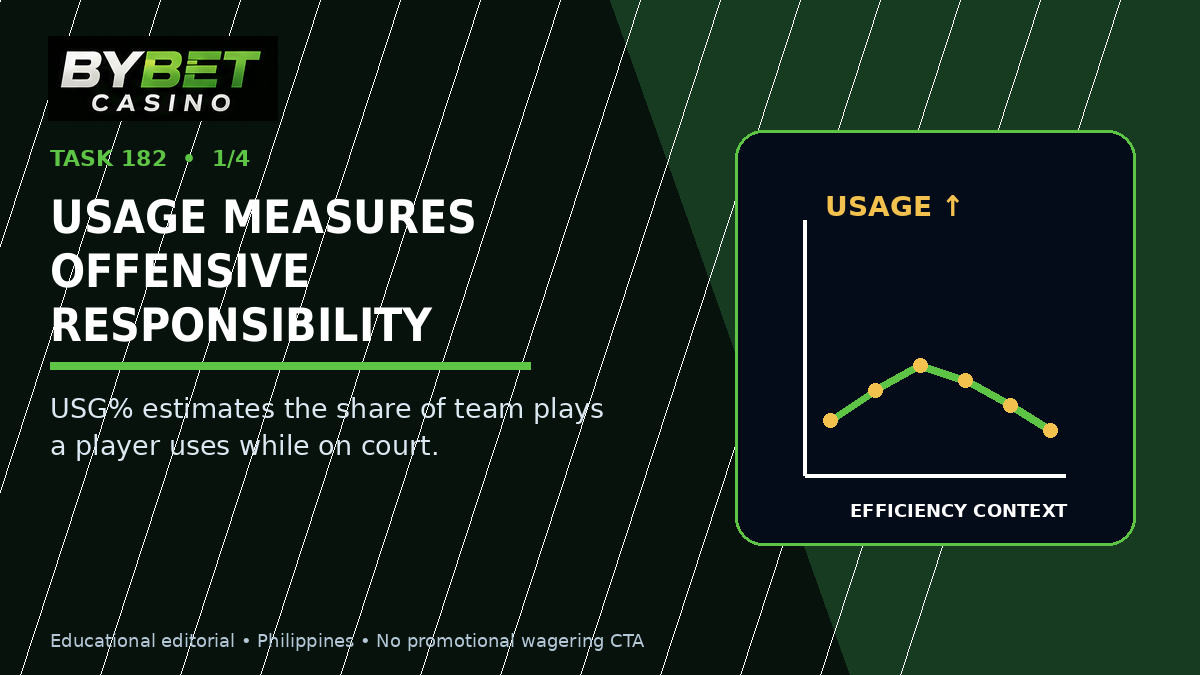
NBA Stats defines Usage Percentage, or USG%, as the percentage of team plays used by a player while that player is on the floor. True Shooting Percentage, or TS%, measures scoring efficiency while accounting for two-point field goals, three-pointers and free throws. A player can rise in one and fall in the other without either number being wrong.
1. Usage percentage is about who finishes possessions
The NBA glossary expresses usage through field-goal attempts, possession-ending free-throw attempts and turnovers relative to possessions. In practical terms, the number rises when a player takes more shots, gets to the line more often, or turns the ball over while finishing more of the team's offensive plays.
Usage does not mean 'time holding the ball.' A point guard can dribble for much of a possession and then create a teammate's shot without ending the play. A center can use a possession quickly with an offensive move after a catch. The metric is about possession endings, not simply touches.
2. True shooting percentage asks how efficiently points were created
TS% expands beyond conventional field-goal percentage by valuing three-pointers correctly and including free throws. NBA Stats gives the familiar formula Points divided by two times field-goal attempts plus 0.44 times free-throw attempts.
That makes TS% useful when two scorers produce points through different shot mixes. One may live at the rim and free-throw line; another may take a large volume of threes. TS% compresses those scoring routes into a broader efficiency measure.
3. A bigger role often means a harder shot diet
When a secondary scorer becomes a first option, the defense changes. The player may see the opponent's best perimeter defender, more traps, fewer catch-and-shoot opportunities and more late-clock possessions. The offense may also ask that player to create after the first action fails.
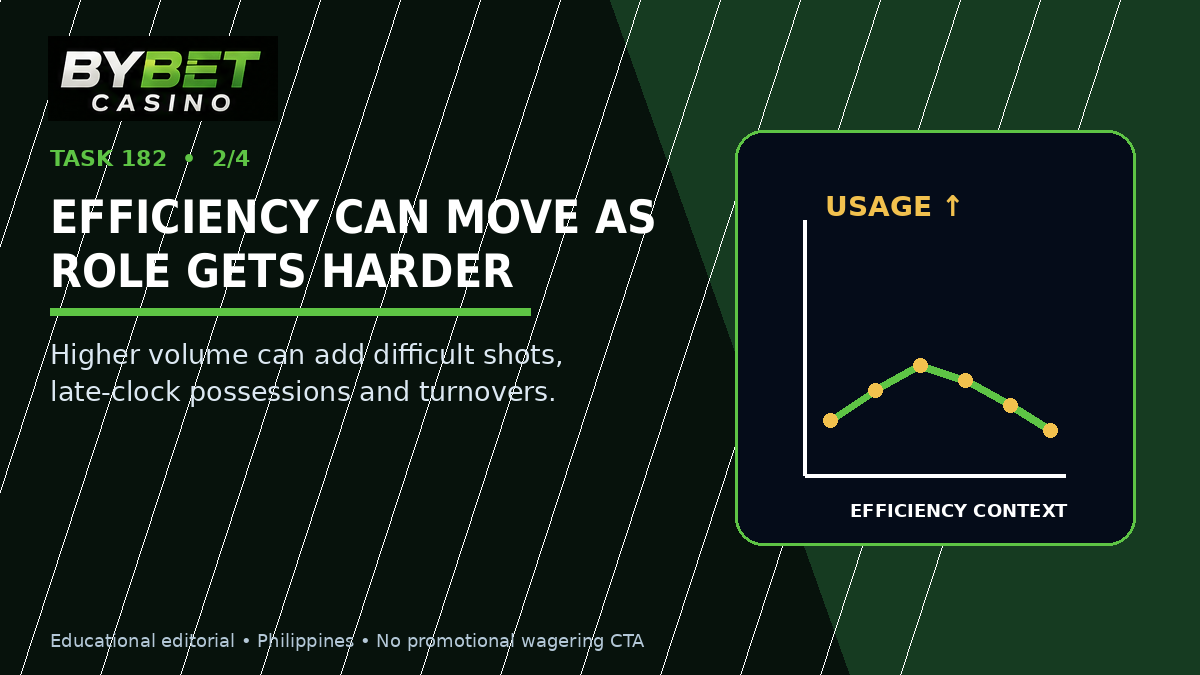
Those attempts are not equivalent to open shots created by someone else. A decline in TS% after a usage increase can therefore reflect role difficulty, not simply worse skill. NBA analysis has repeatedly shown examples in which a jump in usage comes with a change in true shooting.
4. High usage is neither automatically good nor bad
A high-usage player can be extremely valuable if the team needs someone to create difficult offense at acceptable efficiency. The same usage can be harmful if it comes from low-value shot selection, excessive turnovers or possessions that prevent better teammates from participating.
The number therefore needs an efficiency partner. A player at 31% usage with strong TS% is carrying a large scoring burden efficiently. A player at 31% usage with poor TS% may still be serving a necessary role, but the cost of that role is much higher.
5. Low usage does not mean low value
Some players create value without finishing many possessions. A connector can keep the ball moving, screen, cut, defend and create advantages that end with someone else's shot. A rim-running center may be highly efficient on low usage because teammates create most of the opportunities.
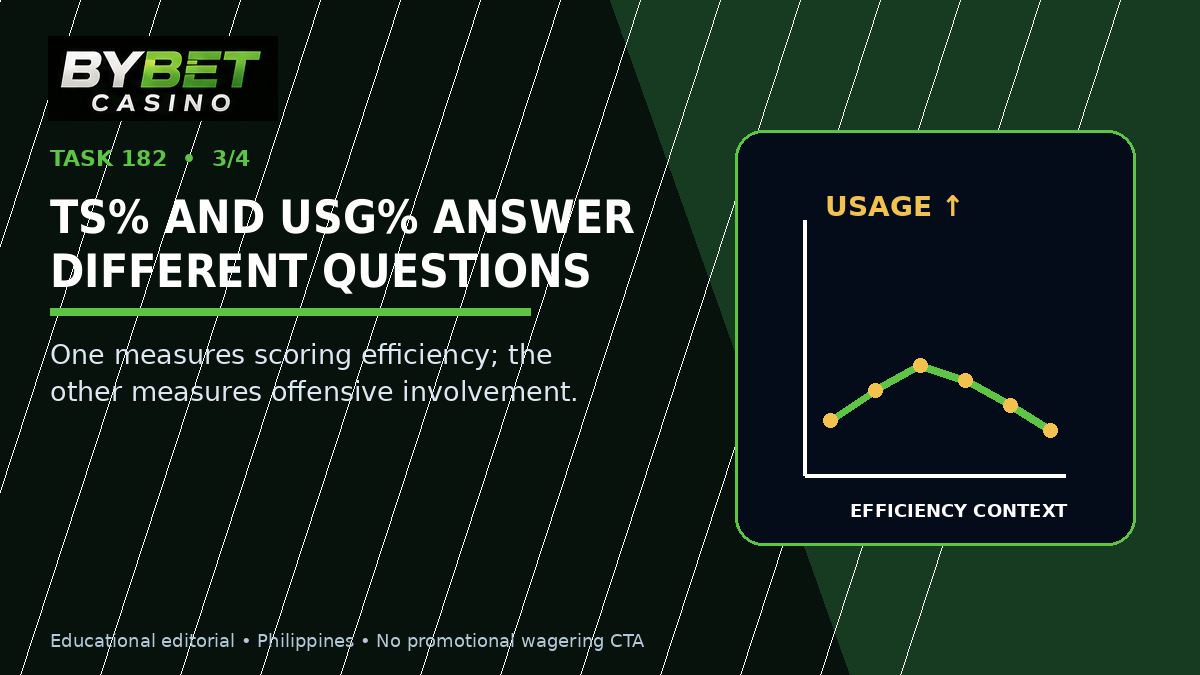
This is why ranking every player by usage would be meaningless. Usage describes responsibility, not complete impact. Likewise, ranking only by TS% would favor narrow finishing roles without accounting for who created the difficult possessions.
6. Turnovers belong in the workload discussion
Usage includes turnovers because a lost possession is still an offensive play a player ended. A creator who increases scoring volume but also sharply increases turnovers may be taking on more than just additional shots.
Separate the kinds of turnovers when possible. Live-ball turnovers can create transition opportunities for the opponent. Offensive fouls, bad passes and lost handles may have different causes. The total belongs in the role picture, but film and play type explain the mechanism.
7. Lineup and spacing change the burden
A scorer surrounded by shooting has larger driving lanes and cleaner passing windows than the same scorer next to several non-shooters. A lineup without a second creator can force one player to initiate every difficult possession. Bench units can also raise a starter's usage because the offense is deliberately staggered around that player.
The Bybet Casino PH sports-betting guide can be treated only as a contextual site reference; the analytics itself should come from league and data sources, and it should never be converted into a guaranteed prediction.

8. Use a simple two-axis reading
Start with usage to estimate workload. Then read TS% to understand scoring efficiency. Add assist rate, turnover rate, shot location, free-throw rate, lineup spacing and opponent quality. Finally, check the sample size.
A ten-game stretch can move both usage and TS% quickly. Role changes after injuries or trades can also create temporary samples that look dramatic before the lineup stabilizes.
Final takeaway
Usage percentage and true shooting percentage answer complementary questions. USG% tells us how much of the offense a player is finishing. TS% tells us how efficiently that scoring volume becomes points. Neither is a complete player grade.
When responsibility rises, efficiency may fall because the job became harder. It may also rise because a player is thriving in the expanded role. The useful conclusion comes from reading both numbers with shot quality, turnovers, lineup context and sample size rather than treating one metric as the whole story.
Sources & Benchmark References
NBA Stats — Stat Glossary: USG% and TS%.
NBA.com — NBA Storylines: changes in usage rate and true shooting.
Basketball-Reference — Advanced player statistics definitions (coverage benchmark).
Bybetcasino.ph — Sports Betting guide, used only as contextual brand reference.
Steemit — native Markdown publishing environment.
Recommended Tags — Delete Before Publishing if Desired
Bybet Casino PH, basketball analytics, usage percentage, USG%, true shooting percentage, TS%, NBA statistics, Philippines
Steemit Publishing Checklist — Delete Before Publishing