How i see BTC just now .... where it can go ....
These are strange times in the markets, yet also a very interesting period a time that will reveal whether we have already been in a new bear market for some time, or if we are still within the bear market that began when was last bull in 2022 - 2023 and are now about to enter a new bull market. 💁♂️
The table in the image is one I created at the start of the current year, 2026. The only addition I made at the beginning of summer ... is green line .... if you look closely at the blurry image and focus on that middle green line with numbers at its peaks, shows that BTC is trending strongly upward, consequently, we could see BTC hit 120k again by the end of the year.
That green line running straight down from the top towards the end marks the point where the new year, 2027, begins.
The blue lines are currently out of play, but the next move will 100% show the strong direction ,either we hit 120 K , or we just sit tight on 80 K or 70 K until the end of the year. 💁♂️👨🏭
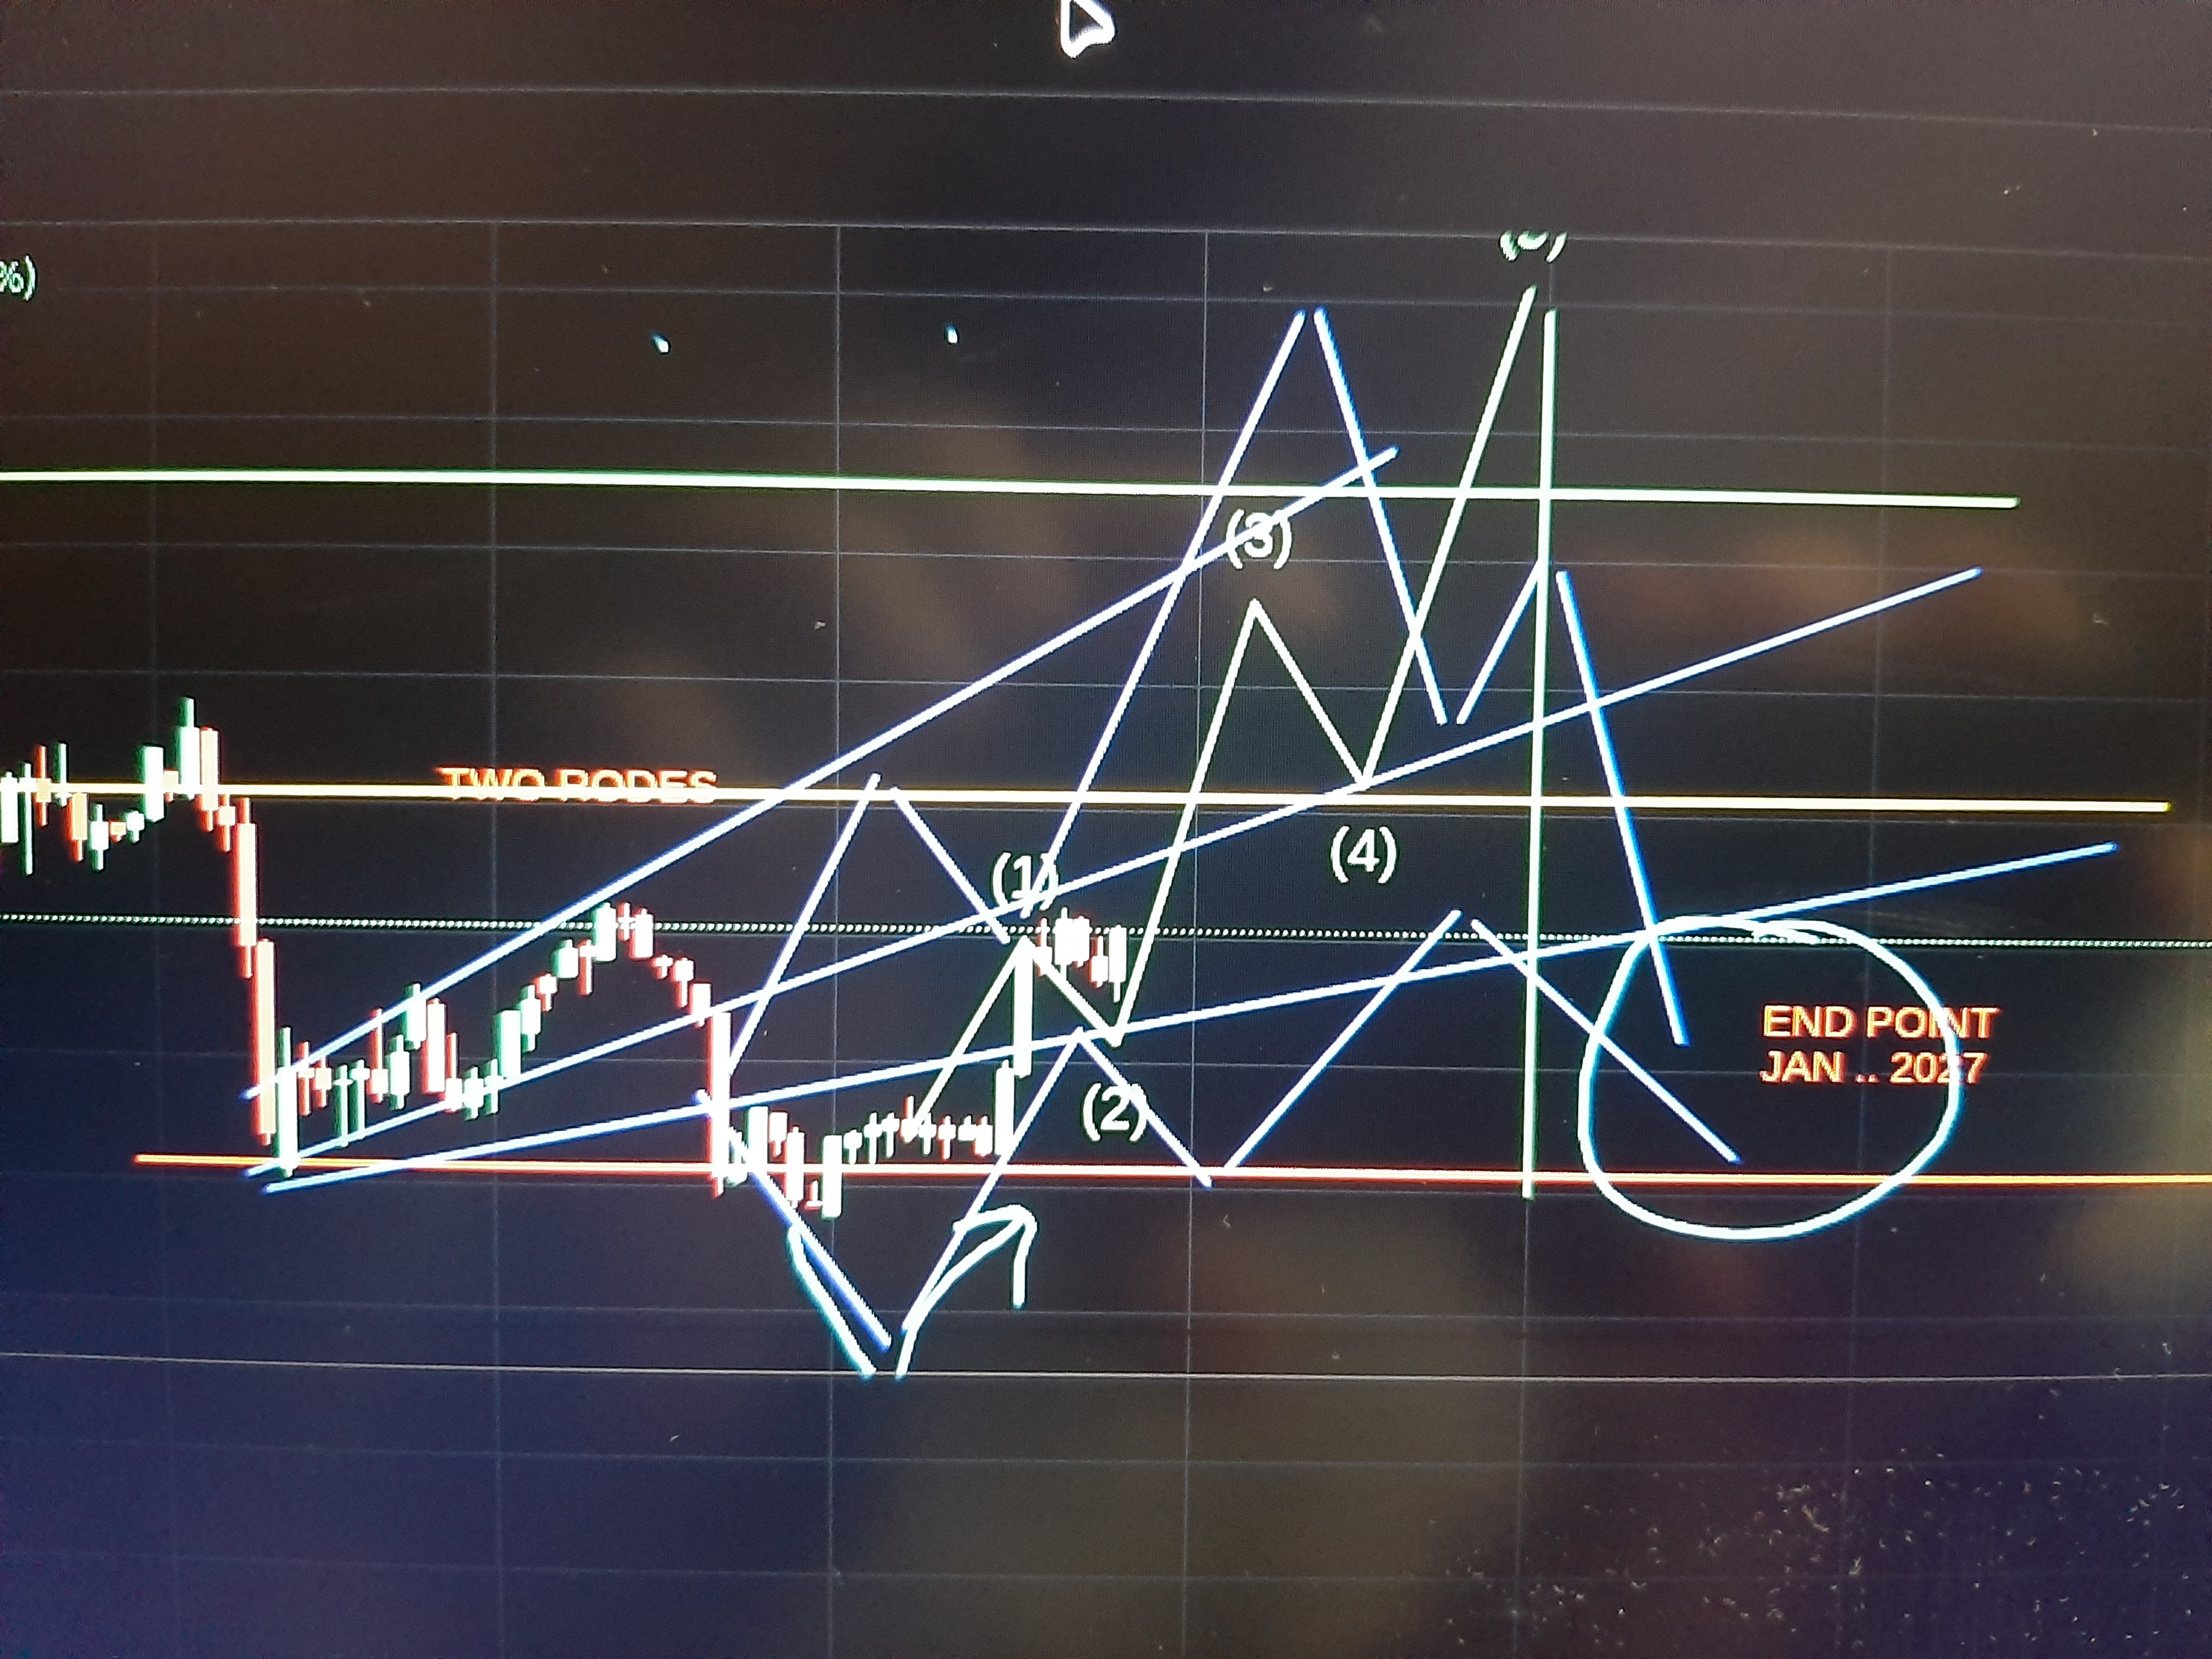
And Yes, my chart is always packed with lines 😆👌👌😎 because I do everything manually, AI and many exchange sites don't always provide honest information to keep updated for every single time 🤭🤭
But I might be seeing things wrong, so always trust your own gut feeling too, I’m simply pointing out that an interesting time has arrived.

Interesting to see how you’ve highlighted the green line peaks; do you think the current volume patterns support a 120 k rally, or should we be cautious of a consolidation around 80 k? 🚀📈💬