How Missing Data Changes Confidence in a Sports Conclusion
How Missing Data Changes Confidence in a Sports Conclusion
Incomplete data do not automatically make an analysis useless, but they change what the evidence can safely support.
Sports analysis can look more complete than it really is. A table may show percentages to one decimal place and a chart may contain dozens of games, but important observations can still be missing. The key question is not only how much data were collected. It is which data are absent, why they are absent, and whether the gaps are concentrated in situations that matter to the conclusion.
That is why data completeness should be checked before a trend is treated as strong evidence. The 711Bet sports-information reference is mentioned here only as a neutral example of a site that publishes sports-related material; the statistical principles below stand independently of any betting market, prediction, or platform claim.
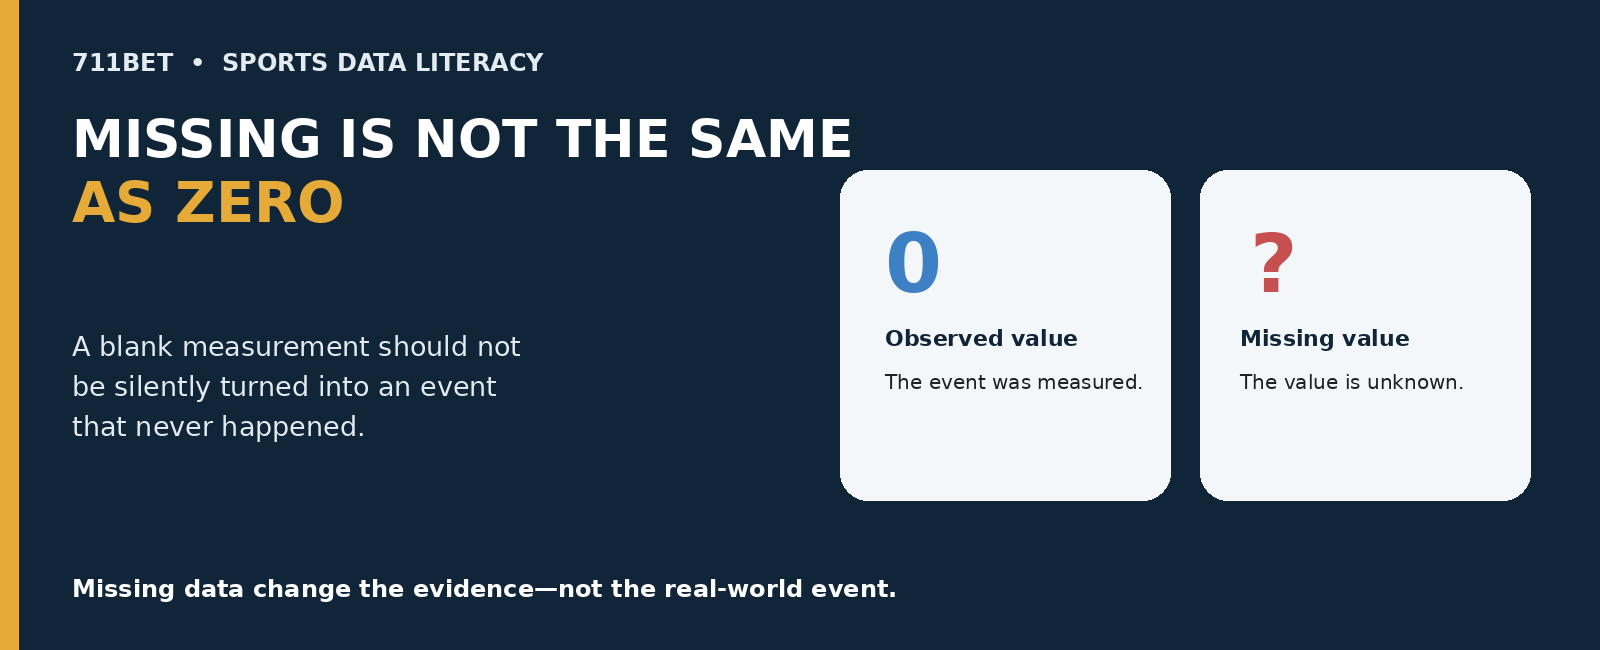
Missing does not mean zero
One of the easiest mistakes is treating an unavailable value as though the event happened and the value was zero.
If a tracking feed fails to record a player's sprint distance for one game, that missing measurement does not mean the player ran zero meters. If a possession-level dataset omits several plays, those possessions disappeared from the dataset, not from the actual game.
NIST defines imputation as replacing unknown, unmeasured, or missing data with a value. That highlights the analyst's real choice: leave the value missing, estimate it, or exclude the affected observation. Each choice can influence the result.
The pattern of missingness matters more than the headline percentage
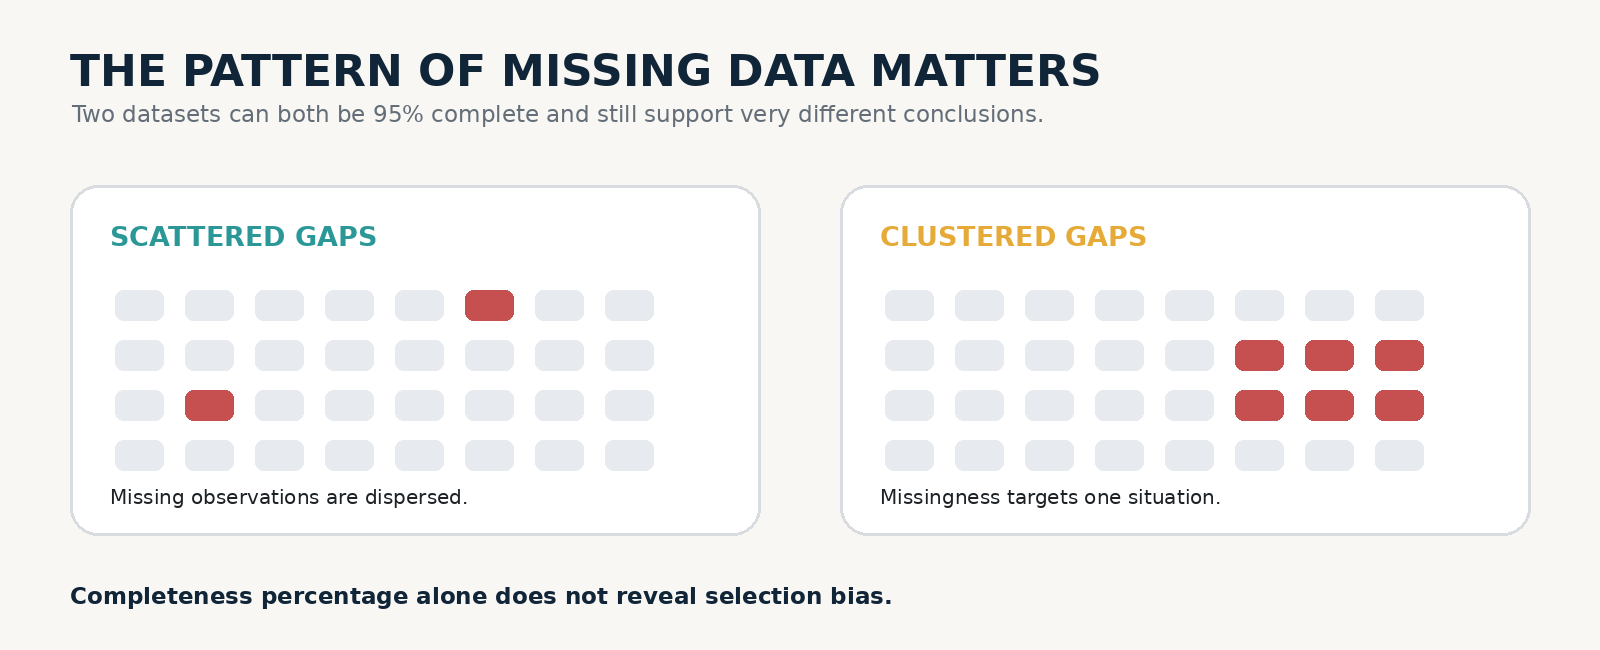
Suppose a basketball dataset contains 95% of a season's observations. The missing 5% might be scattered across ordinary games, or it might contain nearly every game played on the second night of a back-to-back.
Those situations are not equivalent. Random gaps may mainly reduce precision. Systematic gaps can remove exactly the situations that would challenge the conclusion.
So “95% complete” is not a complete quality statement. Analysts should ask whether gaps cluster by opponent, venue, player availability, date range, or another factor connected to the question.
Incomplete samples can change the comparison group
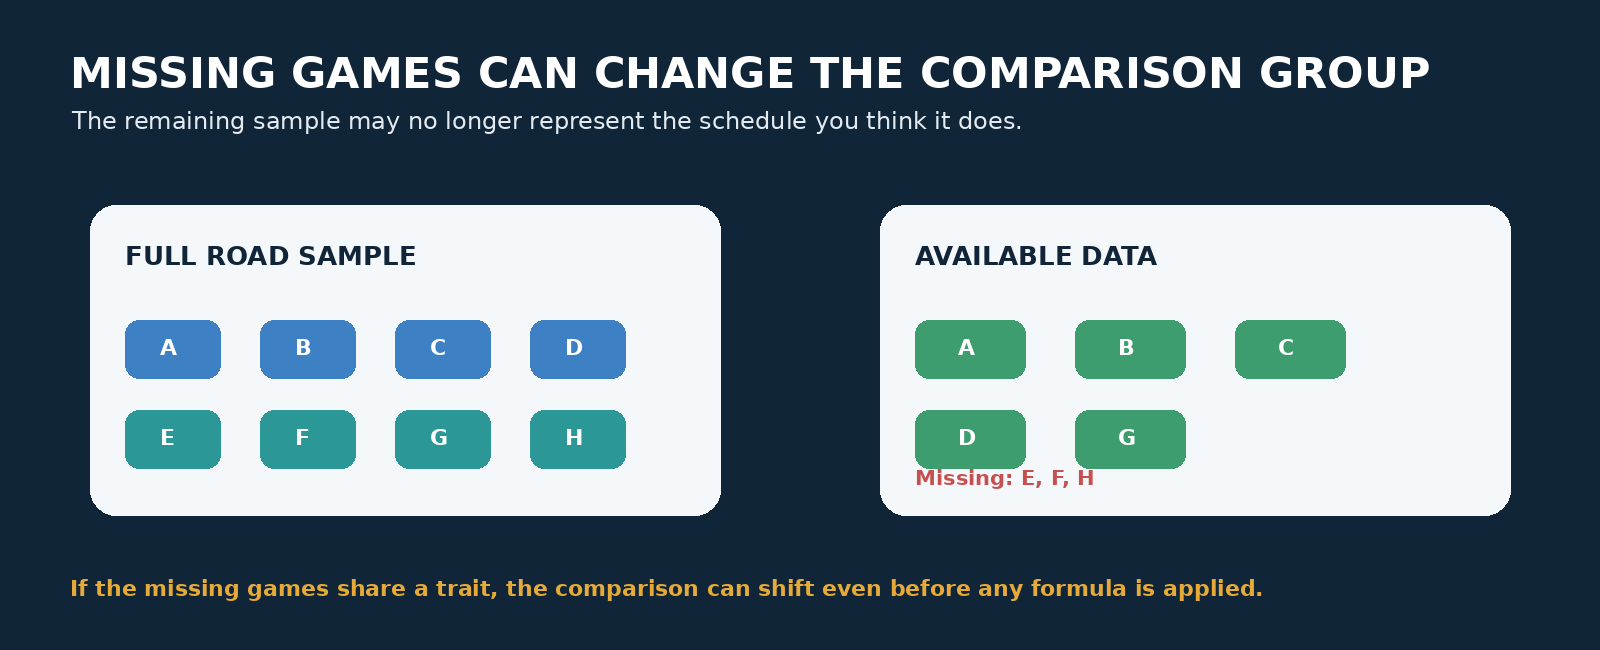
A missing row can change who or what is represented in the remaining sample.
Imagine comparing a team's shooting efficiency at home and on the road. If several road games are absent because a data source failed during one trip, the remaining road sample may contain easier opponents or different lineups than the full schedule. The observed home-road gap could then partly reflect the missing games.
The same issue appears in player analysis. If injury-limited games are systematically absent, the remaining sample may describe healthy performances rather than the player's full season.
A smaller sample increases uncertainty even when missingness is harmless
Sometimes missing data really are unrelated to the outcome being studied. Even then, losing observations usually weakens precision.
NIST's confidence-interval guidance shows the general relationship: larger samples tend to produce narrower intervals, while smaller samples leave more uncertainty around an estimate. You do not need to calculate an interval for every sports article to understand the implication. Fewer observations mean each remaining game carries more influence.
Losing two games from a 10-game split is therefore much more consequential than losing two from an 82-game schedule.
Data quality can vary by statistic inside the same game
Completeness is not always all-or-nothing. A game can have a final score and box-score totals while still missing some tracking or play-by-play detail.
That means analysts should identify which layer of data supports the claim. A statement about final scoring may still be usable when optical-tracking fields are incomplete. A statement about movement speed, shot contests, or possession-level actions may not be.
Official NBA statistics separate basic and advanced metrics, and some derived measures rely on possessions or other inputs. Data quality should therefore be checked at the level of the statistic actually being used.
Missing context can be as important as a missing number
Sometimes every cell is filled while an important explanatory variable is absent. A player's 30-point game may be recorded perfectly, but the dataset may omit that several starters were unavailable. A defensive-rating table may be complete while opponent-strength context is missing.
These gaps are harder to detect because the spreadsheet looks finished. Analysts still need to ask whether the variables needed to explain the trend are actually represented.
Imputation can help, but it cannot manufacture certainty
Replacing missing values can be useful when the method is justified and its assumptions are stated. But filling a gap is not the same as observing what happened.
A simple average replacement can make a table look complete while reducing natural variation. More sophisticated approaches preserve more structure but still depend on assumptions.
For public-facing analysis, a safer practice is to state how many observations are missing, whether any values were estimated, and whether the conclusion changes when those records are excluded.
Sensitivity checks reveal how fragile a conclusion is
A practical way to handle incomplete data is to test more than one reasonable version of the analysis.
Calculate the trend using only complete observations. Then examine what happens when missing games are treated separately or when plausible alternatives are considered. If the conclusion stays similar, confidence in the interpretation improves. If it changes sharply, the result is fragile and should be described that way.
A sensitivity check does not remove uncertainty. It shows how dependent the conclusion is on one questionable data decision.
Good sports reporting should expose the denominator
Readers should be told how much evidence sits behind a percentage or trend. “The team shot 41% from three in tracked games” is more informative when the article also states how many games or attempts were included and whether any were missing.
The denominator might be games, possessions, shots, minutes, or another unit. Exposing it helps readers distinguish a broad pattern from a thin slice of data.
It also prevents polished formatting from creating false confidence. Precision on the page is not the same as precision in the evidence.
A five-question check before trusting an incomplete dataset
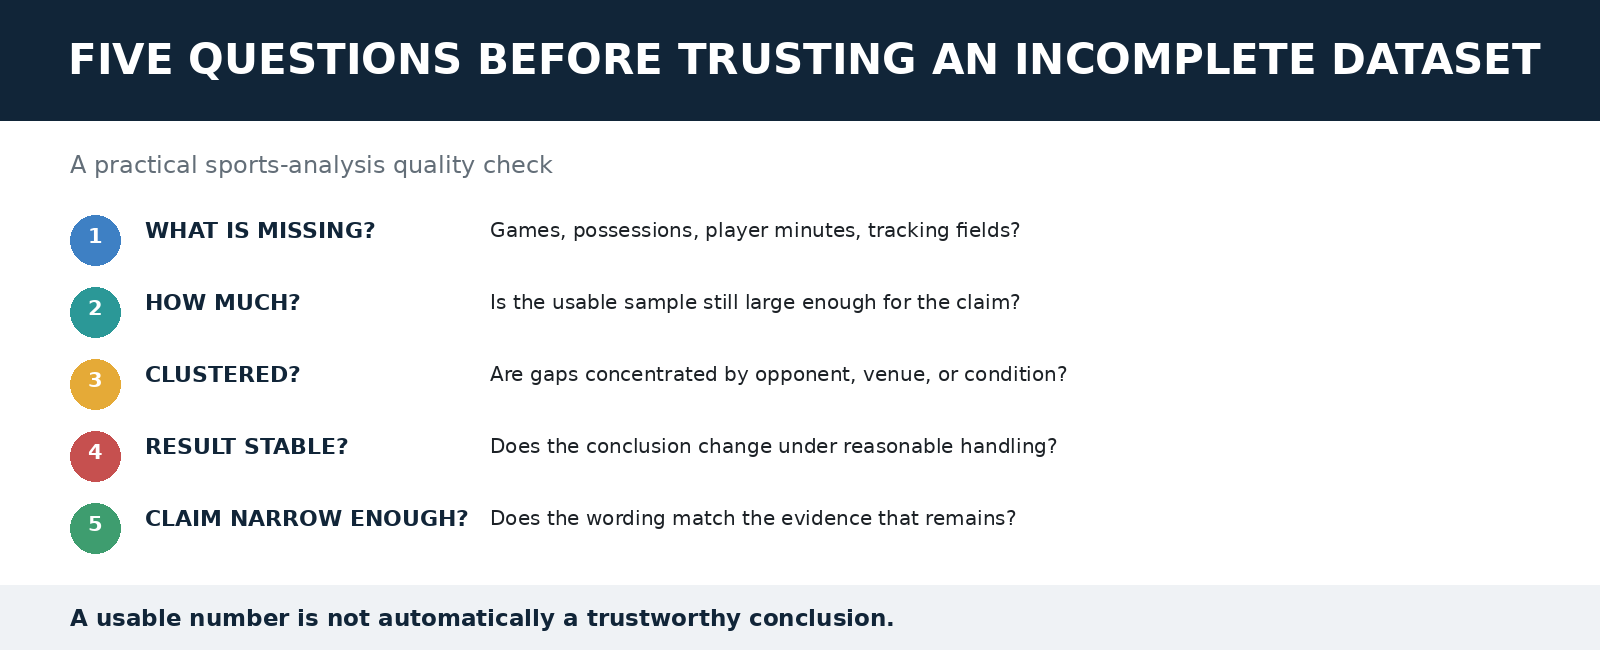
Before drawing a sports conclusion from incomplete data, ask five questions. What is missing? How much is missing? Are the gaps concentrated in a particular type of game or player situation? Does reasonable handling of those gaps materially change the result? Is the conclusion narrow enough for the evidence that remains?
Those questions shift the focus from “Can I calculate a number?” to “What can this dataset actually support?”
Uncertainty is not a defect to hide. It is information about the strength of the evidence.
Final thoughts
Missing data do not automatically invalidate a sports conclusion. Sometimes the remaining sample is still large, representative, and stable enough to support a useful observation. Other times, a small group of missing games changes the comparison completely.
The difference depends on the pattern of missingness, the usable sample size, and the assumptions used to handle gaps.
Trustworthy analysis makes those limits visible. It distinguishes missing from zero, shows the denominator, explains important gaps, and avoids turning an incomplete sample into a stronger claim than the evidence deserves.
Sources & References
NIST/SEMATECH e-Handbook of Statistical Methods — Glossary: Imputation.
NIST/SEMATECH e-Handbook of Statistical Methods — Confidence Limits for the Mean.
NIST/SEMATECH e-Handbook of Statistical Methods — Sample Sizes Required.
NBA Stats — Statistical Glossary and Advanced Team Statistics.
711bet-casino.net — Homepage (neutral contextual brand reference only).
Steemit — Terms of Service.