STEEM/USD 24H Technical Analysis - 2026-09-10
STEEM/USD 24 Hour Market Update
Hello Steem friends.
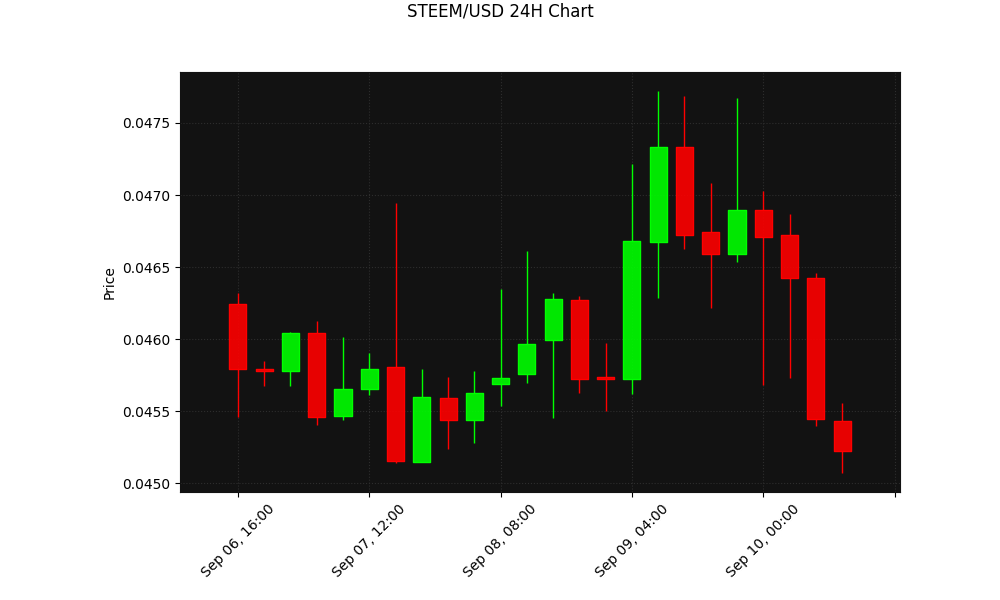
Here is the daily technical look at STEEM. I pulled the 1-hour chart data from CoinGecko to see what the buyers and sellers are doing today.
Current Price Action
STEEM is trading at $0.0452. The 24-hour trend shows clear momentum in the market.
Technical Indicators
The 14-period RSI is at 42.10. This level tells us the asset is currently in the neutral zone.
The 20-period Simple Moving Average is at $0.0460. Price is currently bearish against this line. This usually means the short-term trend is bearish.
Key Levels to Watch
Support is sitting around $0.0451. Resistance is near $0.0477.
What do you think about the chart today? Let me know in the comments.
El mercado muestra que el RSI está en 42.10 y el precio se mantiene bajo la SMA de $0.0460, señalando presión bajista. ¿Cómo percibes la acumulación on‑chain alrededor del soporte de $0.0451 para validar una posible reversión?