STEEM/USD 24H Technical Analysis - 2026-10-24
Hello Steem friends.
Here is the daily technical look at STEEM. I pulled the 1-hour chart data from CoinGecko to see what the buyers and sellers are doing today.
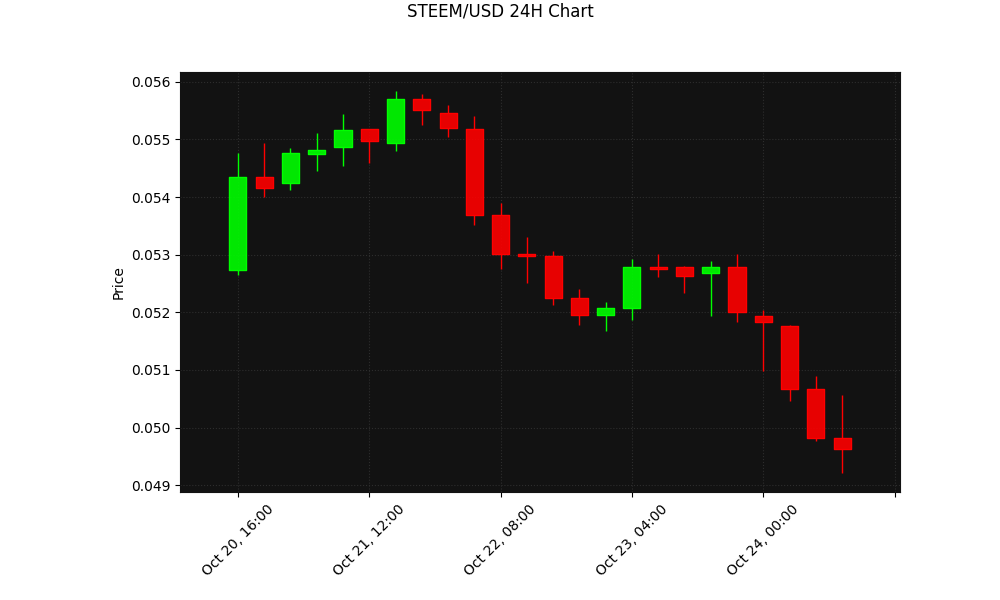
Current Price Action
STEEM is trading at $0.0496. The 24-hour trend shows clear momentum in the market.
Technical Indicators
The 14-period RSI is at 26.70. This level tells us the asset is currently in the oversold zone.
The 20-period Simple Moving Average is at $0.0529. Price is currently bearish against this line. This usually means the short-term trend is bearish.
Key Levels to Watch
Support is sitting around $0.0492. Resistance is near $0.0558.
What do you think about the chart today? Let me know in the comments.
RSI en 26.70 con precio a $0.0496 y soporte en $0.0492, o sea que está testeando el piso justo en zona de sobreventa. El volumen es lo que falta para confirmar acumulación real. ¿Cómo viene el volumen de las últimas horas comparado con el promedio semanal?